Overview
The Xamarin.Forms candle chart visualizes financial data and shows the trends at equal intervals. It can be often combined with line and column charts to show the close and volume of the data.

Key features
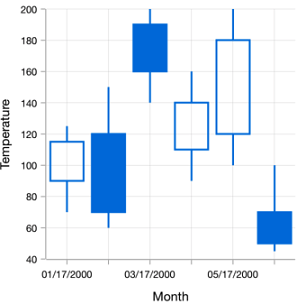
Hollow and filled
Configure the hollow or filled type in candle chart to view stock data from a different perspective.
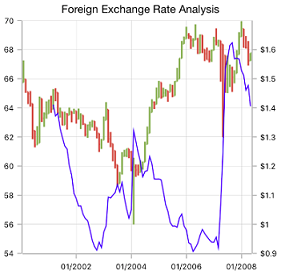
Zooming and scrolling
Supports zooming and scrolling when dealing with large amount of data to visualize the data point in any region.
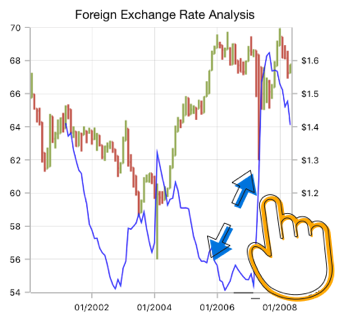
Technical indicators
Supports analyzing historical data and predicting future price movements.
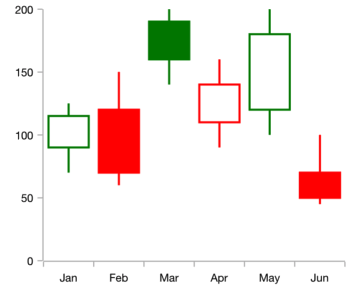
Bull and bear
Customizable bull and bear colors.
Code example
Easily get started with the Xamarin Candle Chart using a few simple lines of C# code example as demonstrated below,
<?xml version="1.0" encoding="utf-8" ?>
<ContentPage xmlns="http://xamarin.com/schemas/2014/forms"
             xmlns:x="http://schemas.microsoft.com/winfx/2009/xaml"
             xmlns:local="clr-namespace:ChartExample"
             xmlns:chart="clr-namespace:Syncfusion.SfChart.XForms;assembly=Syncfusion.SfChart.XForms"
             x:Class="ChartExample.MainPage">

    <ContentPage.BindingContext>
        <local:ViewModel/>
    </ContentPage.BindingContext>

    <chart:SfChart>

        <chart:SfChart.PrimaryAxis>
            <chart:CategoryAxis/>
        </chart:SfChart.PrimaryAxis>

        <chart:SfChart.SecondaryAxis>
            <chart:NumericalAxis/>
        </chart:SfChart.SecondaryAxis>

        <chart:CandleSeries ItemsSource="{Binding Data}" XBindingPath="Year" High="High" Low="Low" Open="Open" Close="Close"/>

    </chart:SfChart>

</ContentPage>
public class Model
{
public string Year { get; set; }
public double High { get; set; }
public double Low { get; set; }
public double Open { get; set; }
public double Close { get; set; }
public Model(string xValue, double open, double high, double low, double close)
{
Year = xValue;
Open = open;
High = high;
Low = low;
Close = close;
}
}
public class ViewModel
{
public ObservableCollection<Model> Data { get; set; }
public ViewModel()
{
Data = new ObservableCollection<Model>()
{
new Model("2010", 873.8, 878.85, 855.5, 860.5),
new Model("2011", 861, 868.4, 835.2, 843.45),
new Model("2012", 846.15, 853, 838.5, 847.5),
new Model("2013", 846, 860.75, 841, 855),
new Model("2014", 841, 845, 827.85, 838.65)
};
}
}Learning resources

Explore the Xamarin.Forms Candle Chart example from GitHub to learn how to render and configure charts.


150+ XAMARIN UI CONTROLS
ALL CONTROLS
-
Xamarin.Forms
-
Xamarin.Android
-
Xamarin.iOS
-
GRIDSDATA VISUALIZATIONNAVIGATIONEDITORSLAYOUTPROJECT MANAGEMENTNOTIFICATIONDOCUMENT PROCESSING LIBRARIESVIEWER/EDITORMISCELLANEOUSCHAT
-
GRIDSDATA VISUALIZATIONNAVIGATIONEDITORSLAYOUTPROJECT MANAGEMENTNOTIFICATIONVIEWER/EDITORDOCUMENT PROCESSING LIBRARIESMISCELLANEOUS
-
GRIDSDATA VISUALIZATIONNAVIGATIONEDITORSLAYOUTPROJECT MANAGEMENTNOTIFICATIONVIEWER/EDITORDOCUMENT PROCESSING LIBRARIESMISCELLANEOUS
The most downloaded control (based on the nuget.org download count).