Overview
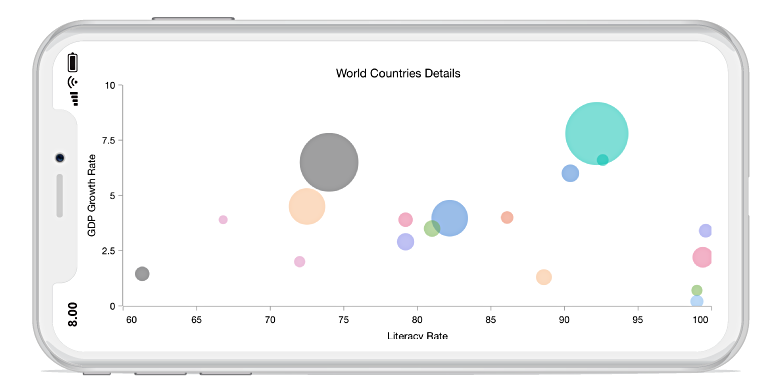
The Xamarin.Forms bubble chart visualizes data in 3 dimensions similar to scatter chart. The position and radius of a circle is determined based on X and Y and size values, respectively.
Key features
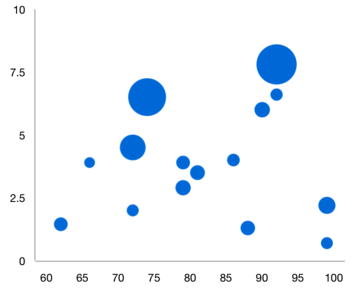
Bubble radius
Control the minimum and maximum radius of the overall bubble series.
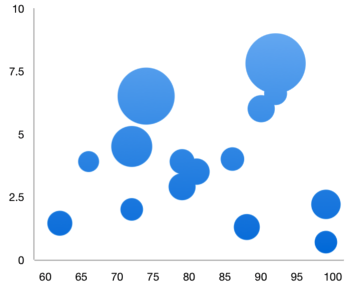
Gradient
Apply gradient colors to visualize data in different colors, improving the readability and appearance of the chart.
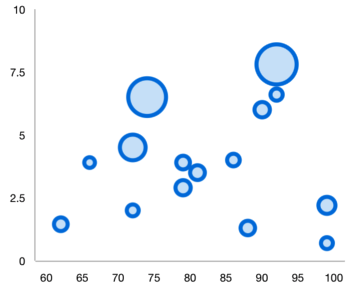
UI customization
Customize the color and border of the bubble chart using built-in APIs to make it visually unique.
Code example
Easily get started with the Xamarin Bubble Chart using a few simple lines of C# code example as demonstrated below,
<?xml version="1.0" encoding="utf-8" ?>
<ContentPage xmlns="http://xamarin.com/schemas/2014/forms"
             xmlns:x="http://schemas.microsoft.com/winfx/2009/xaml"
             xmlns:local="clr-namespace:ChartExample"
             xmlns:chart="clr-namespace:Syncfusion.SfChart.XForms;assembly=Syncfusion.SfChart.XForms"
             x:Class="ChartExample.MainPage">

    <ContentPage.BindingContext>
        <local:ViewModel/>
    </ContentPage.BindingContext>

    <chart:SfChart>

        <chart:SfChart.PrimaryAxis>
            <chart:CategoryAxis/>
        </chart:SfChart.PrimaryAxis>

        <chart:SfChart.SecondaryAxis>
            <chart:NumericalAxis/>
        </chart:SfChart.SecondaryAxis>

        <chart:BubbleSeries ItemsSource="{Binding Data}" XBindingPath="Month" YBindingPath="Target" Size="Size"/>

    </chart:SfChart>

</ContentPage>
public class Model
{
public string Month { get; set; }
public double Target { get; set; }
public double Size { get; set; }
public Model(string xValue, double yValue, double size)
{
Month = xValue;
Target = yValue;
Size = size;
}
}
public class ViewModel
{
public ObservableCollection<Model> Data { get; set; }
public ViewModel()
{
Data = new ObservableCollection<Model>()
{
new Model("Jan", 50, 17),
new Model("Feb", 70, 12),
new Model("Mar", 65, 14),
new Model("Apr", 57, 18),
new Model("May", 48, 13),
};
}
}Learning resources

Explore the Xamarin.Forms Bubble Chart example from GitHub to learn how to render and configure charts.


150+ XAMARIN UI CONTROLS
ALL CONTROLS
-
Xamarin.Forms
-
Xamarin.Android
-
Xamarin.iOS
-
GRIDSDATA VISUALIZATIONNAVIGATIONEDITORSLAYOUTPROJECT MANAGEMENTNOTIFICATIONDOCUMENT PROCESSING LIBRARIESVIEWER/EDITORMISCELLANEOUSCHAT
-
GRIDSDATA VISUALIZATIONNAVIGATIONEDITORSLAYOUTPROJECT MANAGEMENTNOTIFICATIONVIEWER/EDITORDOCUMENT PROCESSING LIBRARIESMISCELLANEOUS
-
GRIDSDATA VISUALIZATIONNAVIGATIONEDITORSLAYOUTPROJECT MANAGEMENTNOTIFICATIONVIEWER/EDITORDOCUMENT PROCESSING LIBRARIESMISCELLANEOUS
The most downloaded control (based on the nuget.org download count).