
Xamarin.Forms Maps - Interactive & Powerful Data Visualization Control
- Built-in, online map to display OpenStreetMap, Bing maps, and maps from other providers.
- Graphical representations of geographical points from shape files.
- Pins can be placed on maps to show the current or a particular location.
Trusted by the world’s leading companies

Overview
Xamarin.Forms Maps is a powerful data visualization component that displays statistical information for a geographical area. It has highly interactive and customizable features such as zooming, panning, selecting, legends, markers, bubbles, and color mapping. Using the Maps control, you can render various maps, such as for sales, political boundaries, weather, elections, and routes.

Shape layers
Shape layers provide options to render geographical shapes or custom shapes in Xamarin.Forms Maps.

Data
Shapefiles (.shp) and GeoJSON (.json) data can be bound to maps to render any geometric shape.

Customization
The default style of a shape can be customized using the color, stroke, and thickness properties.
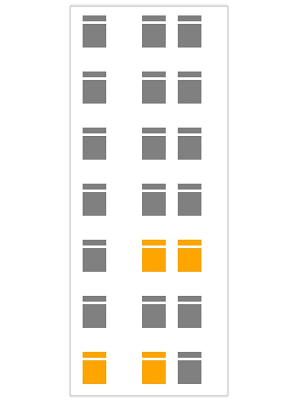
Custom shapes
The Xamarin.Forms Maps control allows you to render any custom shape to make a map look like building infrastructure, a sports stadium, plane or bus seat arrangements, and more.

Sublayer
Load multiple shape files in a single map view. For example, add a sublayer over a main shape layer to view geographic features of a country such as rivers, valleys, and cities.
Imagery layers
Built-in support for external imagery services, such as Bing Maps and OpenStreetMap, is used to visualize satellite, aerial, street map, and other imagery tiles without using shapefiles. Apart from Bing maps and OpenStreetMap, you can also render maps from other map providers such as Google Maps and TomTom.

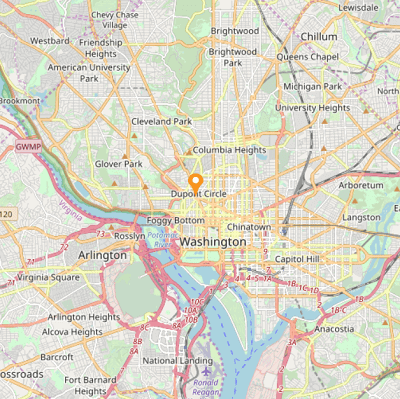
OpenStreetMap (OSM)
Xamarin OpenStreetMap (OSM) is a map of the world built by a community of mapmakers that is free to use under an open license. It allows users to view geographical data in a collaborative way from anywhere on Earth.

Bing Maps
Xamarin Bing Maps, owned by Microsoft, is a map of the entire world. It supports three types of map views: aerial, aerial with labels, and road.
Auto zoom
Set the initial zoom level automatically based on map geo-bounds or distance (KM/miles) from a geo-point center value.
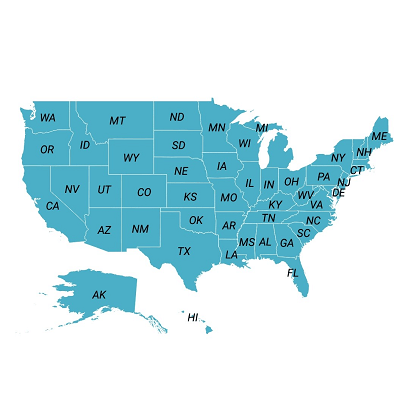
Data labels
Xamarin Map shapes can be easily annotated with labels to improve the readability of particular shape’s names.
Label customization
The look and feel of the default labels can be customized using the font style, size, and color properties.

Smart label alignments
Labels can be aligned smartly within shape boundaries and can be trimmed or hidden to avoid labels overlapping.
Heat map
Produce a heat map by customizing shape colors based on the underlying shape value.

Equal color mapping
Equal color mapping differentiates a shape’s fill color based on its underlying value and color. For example, colors are applied to the countries based on their time zones.

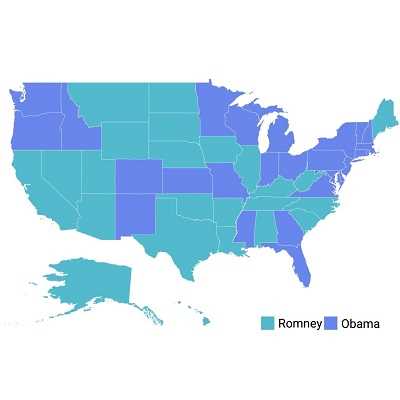
Range color mapping
Colors can be applied to shapes depending on the numeric ranges. For example, colors can be applied to states based on their population density.
Maps markers
Markers allow you to denote a place with symbols, like pins, or display a message at specific coordinates on a map.

Marker types
The marker type can be changed to built-in shapes such as circles, diamonds, rectangles, or squares to highlight a place.

Custom markers
Customize markers by adding images or any custom shape to highlight a location.
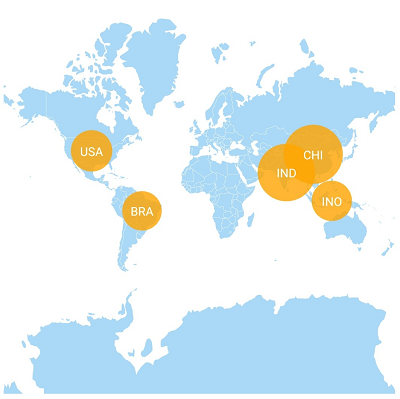
Map bubbles
Bubbles are used to add additional information to shapes such as population density or land area. They are rendered with various magnitudes and colors based on the underlying data values of the shapes.

Color customization
The default color of a bubble and its transparency can be customized using the fill and opacity properties.
Size customization
The minimum and maximum sizes of a bubble can be customized.
Maps legend
A legend is used to provide valuable information for interpreting maps with various colors, shapes, or other identifiers based on the data and application requirements.
Legend position
The position of a legend can be changed or moved to any place inside the maps.
![]()
Icon customization
The default size of a legend icon can be customized.
User interactions
The end user experience is greatly enhanced by a set of user interaction features such as selection, zooming, and panning.
Selection
A particular area or shape can be selected or highlighted on user interaction to bring the center of the view over other shapes in a map.
Zooming and panning
Zooming allows end users to get a closer look at a particular area of interest on a map by stretching and pinching it. Panning allows end users to move a map around to focus on a specific area and navigate across its regions.
Drilling down
Drill down in a map to display different shape data located on another layer. For example, you can drill down to a continent in a world map to show the continent separately on another layer.

Tooltip
The tooltip control displays a pop-up with additional information about the shapes, markers, and bubbles when the end user taps the Xamarin.Forms Maps elements.
Xamarin.Forms Maps Code Example
Easily get started with Xamarin.Forms Maps using a few simple lines of XAML and C# code, as demonstrated below. Also explore our Xamarin.Forms Maps Example that shows you how to render the Xamarin.Forms Maps control.
<maps:SfMaps>

<maps:SfMaps.Layers>

<maps:ShapeFileLayer/>

</maps:SfMaps.Layers>

</maps:SfMaps>
using Syncfusion.SfMaps.XForms;
SfMaps maps = new SfMaps();
ShapeFileLayer layer = new ShapeFileLayer();
maps.Layers.Add(layer);
SetContentView(maps);Not sure how to create your first Xamarin.Forms Maps? Our documentation can help.
I’d love to read it now150+ XAMARIN UI CONTROLS
ALL CONTROLS
-
Xamarin.Forms
-
Xamarin.Android
-
Xamarin.iOS
-
GRIDSDATA VISUALIZATIONNAVIGATIONEDITORSLAYOUTPROJECT MANAGEMENTNOTIFICATIONDOCUMENT PROCESSING LIBRARIESVIEWER/EDITORMISCELLANEOUSCHAT
-
GRIDSDATA VISUALIZATIONNAVIGATIONEDITORSLAYOUTPROJECT MANAGEMENTNOTIFICATIONVIEWER/EDITORDOCUMENT PROCESSING LIBRARIESMISCELLANEOUS
-
GRIDSDATA VISUALIZATIONNAVIGATIONEDITORSLAYOUTPROJECT MANAGEMENTNOTIFICATIONVIEWER/EDITORDOCUMENT PROCESSING LIBRARIESMISCELLANEOUS
The most downloaded control (based on the nuget.org download count).
Frequently Asked Questions
Why should you choose Syncfusion Xamarin.Forms Maps?
The Syncfusion Xamarin Maps supports the following features:
Built-in, online map to display OpenStreetMap, Bing maps, Google Maps and maps from other providers.
Graphical representations of geographical points from shape files.
Pins or markers placed on maps to show current location or other locations.
- One of the best Xamarin.Forms Maps in the market that offers feature-rich UI to interact with the software.
- Simple configuration and API.
- Use a lightweight and truly native.
Expansive learning resources such as demos and documentation to learn quickly and get started with Xamarin Maps.
Where can I find the Syncfusion Xamarin.Forms Maps demo?
You can find our Xamarin Maps demo, which demonstrates how to render and configure Maps.
Can I download and utilize the Syncfusion Xamarin.Forms Maps for free?
No, this is a commercial product and requires a paid license. However, a free community license is also available for companies and individuals whose organizations have less than $1 million USD in annual gross revenue, 5 or fewer developers, and 10 or fewer total employees.
How do I get started with Syncfusion Xamarin.Forms Maps?
A good place to start would be our comprehensive getting started documentation.
Our Customers Love Us
Having an excellent set of tools and a great support team, Syncfusion® reduces customers’ development time.Here are some of their experiences.

Amazing tool, great designs
Using Xamarin templates from Syncfusion I can focus on the code and do not have to worry about design. Very easy to implement.

Dirk F,

Software Development Engineer, Small-Business
Essential for any Xamarin developer!
A large number of components that complement or improve almost everything that does not yet exist in Xamarin. The support is the best I've ever seen! They fix bugs quickly and are always willing to listen to suggestions.

Cezar W,
Co-Founder, Small-Business
Rated by users across the globe
Syncfusion Xamarin.Forms Resources
Learning
 Documentation
 Documentation


Awards
Greatness—it’s one thing to say you have it, but it means more when others recognize it. Syncfusion® is proud to hold the following industry awards.

