We use cookies to give you the best experience on our website. If you continue to browse, then you agree to our privacy policy and cookie policy.


The Blazor Pivot Table is a powerful control used to organize and summarize business data and display the result in a cross-table format. It includes major functionalities such as data binding, drilling up and down, Excel-like filtering and sorting, editing, Excel and PDF exporting, several built-in aggregations, pivot table field list, and calculated fields. A high volume of pivot data can be loaded without any performance degradation using row and column virtualization.

Well thought-out and focused on fast-paced performance to load millions of records in just a second.

Bind data seamlessly with various local and remote data sources such as JSON, OData, WCF, and RESTful web services with the help of a data manager.

Users can perform actions on raw data at runtime, including create, read, update, and delete. Through an interactive user interface, the control provides several edit modes, including inline, dialog, batch, and column.

You can easily integrate your Pivot Table with independently rendered pivot data. It has support for more than 20 chart types.

Users can easily change a Pivot Table cell value’s appearance(background color, font color, font family, and font size) as required.

Pivot Table has a highly responsive layout and an optimized design for desktops, touchscreens, and smart phones. It works well on all mobile phones that use iOS, Android, or Windows OS.

Cutting-edge design with several built-in themes, such as Fluent, Tailwind CSS, Bootstrap, Material, and Fabric. Utilize the online Theme Studio tool to customize themes easily.

Enables users from different locales to use the component by formatting dates, currency, and numbering to suit preferences.
Easily get started with the Blazor Pivot Table using a few simple lines of C# code as demonstrated in the following. Also, explore our Blazor Pivot Table example, which shows you how to render and configure the Blazor Pivot Grid.
@using Syncfusion.Blazor.PivotView

<SfPivotView TValue="ProductDetails" Height="300">
     <PivotViewDataSourceSettings DataSource="@dataSource">
        <PivotViewColumns>
            <PivotViewColumn Name="Year"></PivotViewColumn>
            <PivotViewColumn Name="Quarter"></PivotViewColumn>
        </PivotViewColumns>
        <PivotViewRows>
            <PivotViewRow Name="Country"></PivotViewRow>
            <PivotViewRow Name="Products"></PivotViewRow>
        </PivotViewRows>
        <PivotViewValues>
            <PivotViewValue Name="Sold" Caption="Units Sold"></PivotViewValue>
            <PivotViewValue Name="Amount" Caption="Sold Amount"></PivotViewValue>
        </PivotViewValues>
        <PivotViewFormatSettings>
            <PivotViewFormatSetting Name="Amount" Format="C"></PivotViewFormatSetting>
        </PivotViewFormatSettings>
    </PivotViewDataSourceSettings>
</SfPivotView>

@code{
    public List<ProductDetails> dataSource { get; set; }
    protected override void OnInitialized()
    {
       this.dataSource = ProductDetails.GetProductData().ToList();
    }

    public class ProductDetails
    {
        public int Sold { get; set; }
        public double Amount { get; set; }
        public string Country { get; set; }
        public string Products { get; set; }
        public string Year { get; set; }
        public string Quarter { get; set; }

        public static List<ProductDetails> GetProductData()
        {
            List<ProductDetails> productData = new List<ProductDetails>();
            productData.Add(new ProductDetails { Sold = 97, Amount = 104168, Country = "United States", Products = "Road Bikes", Year = "FY 2016", Quarter = "Q4" });
            productData.Add(new ProductDetails { Sold = 95, Amount = 837800, Country = "United States", Products = "Road Bikes", Year = "FY 2017", Quarter = "Q1" });
            productData.Add(new ProductDetails { Sold = 87, Amount = 684168, Country = "United States", Products = "Road Bikes", Year = "FY 2017", Quarter = "Q2" });
            return productData;
        }
    }
}
The Blazor Pivot Chart can easily be integrated with pivot data rendered independently, including functionality for plotting more than 20 types of pivot charts. The end user experience is greatly enhanced by including a set of user-interactive features such as zooming, panning, crosshair, trackball, events, selection, and tooltip. Highly interactive field list options are available for generating reports on top of the relational data dynamically.
Large amounts of data can be divided and displayed in the rows and columns of the current viewport using the virtual scrolling feature. You can navigate to a desired view by scrolling the vertical and horizontal scrollbars.


Large amounts of data can be divided and displayed page by page using the paging feature. The pager UI allows users to navigate to the desired page using the navigation buttons or an input text box. Change the row and column page sizes independently at runtime. Furthermore, toggle the position of the row and column pagers, modify their visibility, and visualize them using a compact view mode.
The Blazor Pivot Table field list and group fields options are automatically populated with fields from the bound data source. They allow end users to drag, filter, and sort fields, as well as create pivot reports at runtime.


The Blazor Pivot Table can be connected to an OLAP cube, and its result can be visualized in both tabular and graphical formats.
Users can refresh the component on demand instead of during every UI interaction in the Blazor Pivot Table.


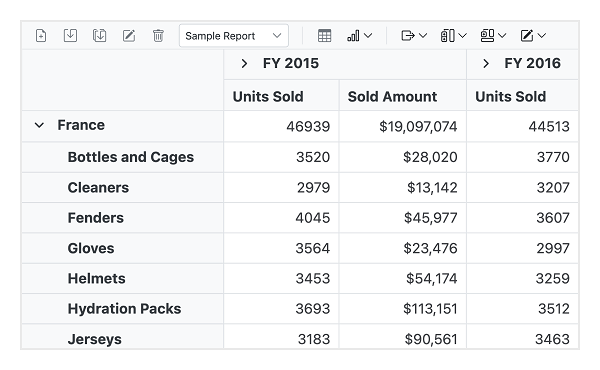
Use built-in drill down (expand) and drill up (collapse) capabilities to visualize data both in a detailed view and abstract view, respectively. By default, data is displayed in a grouped manner.
Users can create, read, update, and delete operations for raw data at runtime and update their changes to the underlying data source, thereby reflecting the information in all corresponding cells. The Blazor Pivot Table component supports various edit modes such as inline, dialog, batch edit, and column edit through an interactive UI.

Built-in member function and Excel-like filters with advanced filtering options can be used to easily filter and view data as required. It is also possible to filter data programmatically in the Blazor Pivot Table.

Display only selective values for a field. This can be achieved either through UI or code-behind.
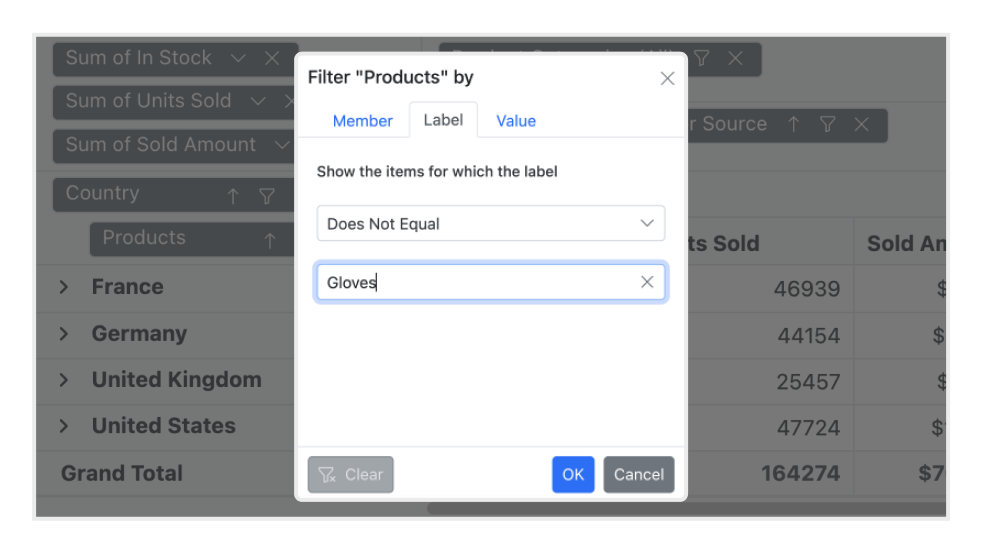
Use Excel-like filtering options across column and row headers based on label text, date, or number.
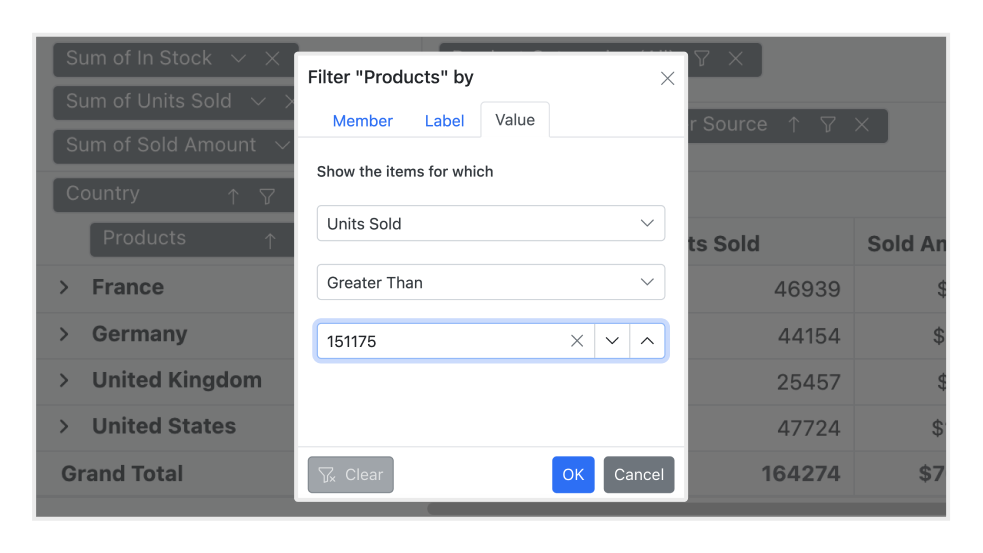
Use Excel-like filtering options across column and row headers based on grand total values.
Sort to order rows and columns based on either labels or values.

Order the column and row header text either in ascending or descending order.

Column sorting, also known as value sorting, orders the column values either in ascending or descending order. It is performed by clicking the header of the column you wish to sort.

Users can perform calculations on a group of values using the aggregation option. By default, values are added together. The other aggregation types are average, minimum, maximum, count, distinct count, product, index, population standard deviation, sample standard deviation, population variance, sample variance, running totals, difference from, percent of difference from, and percent of grand total.
The calculated field, otherwise known as the unbound field, generates a unique field with the user’s own calculated values by executing a simple user-defined formula.


The drill through feature easily obtains a list of raw items for a particular value cell or summary cell.
Subtotals and grand totals are calculated automatically by the pivot engine in the component and displayed in the Pivot Table. This helps users make decisions based on the totals. Also, users can show or hide subtotals and grand totals for rows and columns.


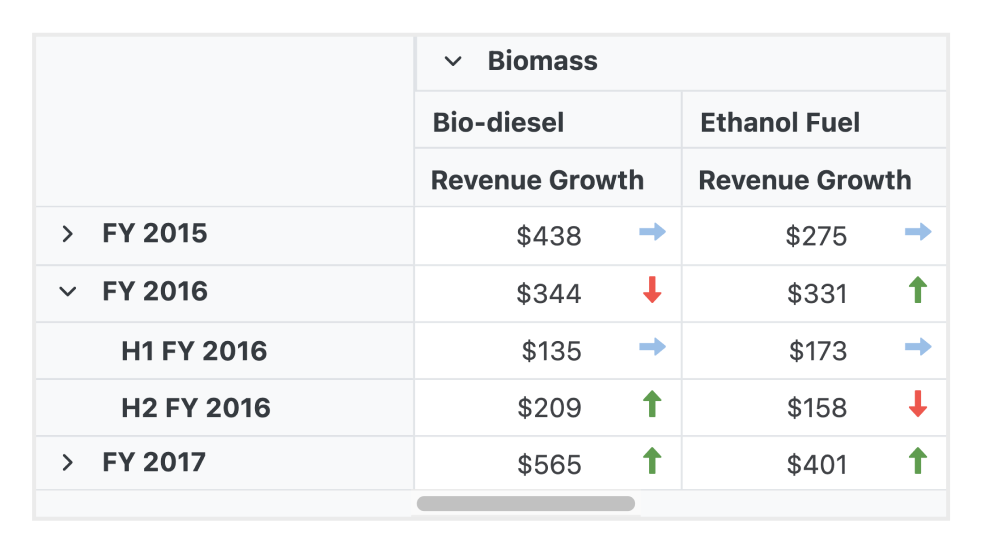
Users can define conditions that, when met, format font style, text color, background color, and font size for values and summary cells.
Number and date formatting helps transform the appearance of the actual cell value.


The Blazor Pivot Table component automatically groups dates and numbers, so that the date type can be formatted and displayed based on year, quarter, month, day, and more. The number type can be grouped by range, such as 1-5 or 6-10.
You can freeze row and column headers to scroll and compare them with cell values.


Resizing allows changing column width at runtime by simply dragging the right-most boundary of the column header. The scroll bar will appear when the content width exceeds the component width.

You can reorder the columns either on user interaction or programmatically. Simply dragging and dropping a column header into the desired column position will reorder the columns.

Users can retrieve information about a particular cell on clicking a hyperlink cell. It later allows them to perform custom operations programmatically.

A tooltip provides basic information about a cell when hovering over it.
With cell templates, users can add features like images, checkboxes, and text nodes to any cell with ease.
The Toolbar feature provides a built-in interface for pivot tables to select frequently used features interactively for easy access. These features include new report, save report, save as report, rename report, delete report, report list, show grid, show chart, show or hide totals, export reports, and more.
Export Blazor Pivot Table data to Excel, PDF, and CSV formats. You can also customize the exported document by adding header, footer, and cell properties like type, style, and position programmatically.


All features will work on touch devices. Features such as drill up and down, filtering, sorting, and report manipulation can be done on the fly.

Responsive support allows the component layout to be viewed on various devices.

The Blazor Pivot Table ensures that every cell is keyboard accessible. Major features like expanding or collapsing child rows, sort, select, and edit can be performed using keyboard commands alone; no mouse interaction required. This helps in creating highly accessible applications using this component.

Supports right-to-left rendering and allows the text direction and layout of the component to be displayed from right to left.
Pivot Table is also available in Angular, React, Vue, and JavaScript frameworks, all built from their own TypeScript libraries. Check out the Pivot Table for different platforms from the links:
It is necessary for the Blazor Pivot Table to works well with all modern web browsers such as Chrome, Firefox, Microsoft Edge, Safari, and Opera.
You can find our Blazor Pivot Table demo, which demonstrates how to render and configure the Pivot Table.
No, this is a commercial product and requires a paid license. However, a free community license is also available for companies and individuals whose organizations have less than $1 million USD in annual gross revenue, 5 or fewer developers, and 10 or fewer total employees.
A good place to start would be our comprehensive getting started documentation.


 Documentation
Greatness—it’s one thing to say you have it, but it means more when others recognize it. Syncfusion is proud to hold the following industry awards.


