Overview
End users can enable the following built-in features of Pivot Chart either through UI or a simple, user-friendly APIs in code behind.
Chart types
The control supports common chart types: column, area, bar, line, pie, scatter, spline, spline area, stacking bar, stacking area, 100% stacking bar, stacking column, 100% stacking column, step area, step line. Each chart type is easily configurable at runtime for creating stunning visual effects.
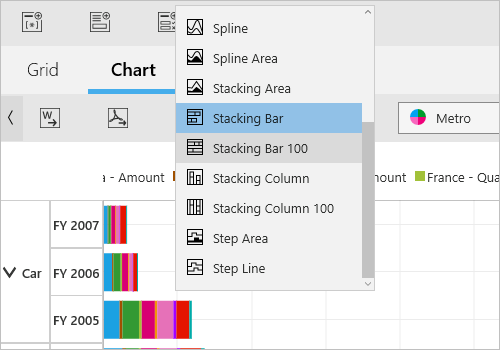
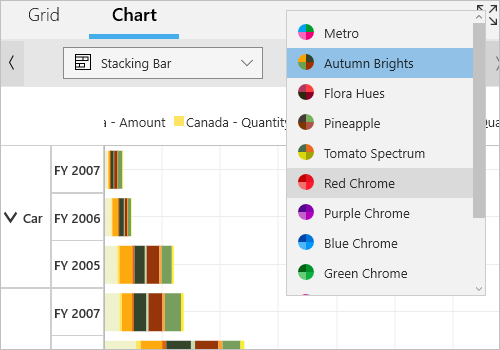
Chart palettes
A set of built-in color palettes are automatically applied to the data points if no custom colors are specified for the series.
Series customization
Customize the series color, border color, and border width of the control. You can do this in code behind.
Legends
A color code helps to differentiate among chart series items. A legend has labels beside each color to present some detail about the series.
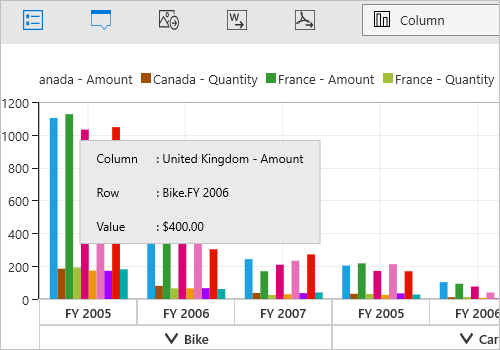
Tooltip
A tooltip provides basic information about a series while hovering the mouse pointer over it.
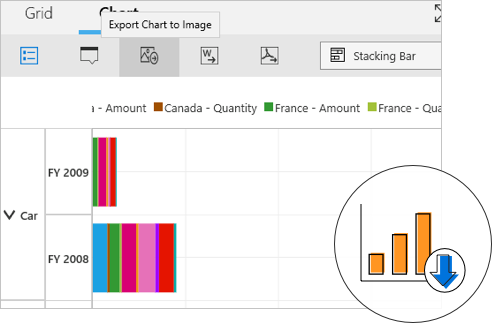
Exporting
You can export a pivot chart to Excel, image (BMP, JPG, JPEG, PNG), or PDF document. Several options are also provided to customize the exporting operations.