ASP.NET Core Stock Chart - Visualize Market Data Efficiently
- Visualize and analyze stock data with candlestick, OHLC, HiLo Chart.
- Interact and explore stock charts with features such as zooming, panning, crosshairs, tooltips, trackballs, period selector, range selector, and more.
- Experience seamless interaction and responsiveness with smooth animation.

Trusted by the world’s leading companies

Overview
ASP.NET Core Stock Chart is a well-crafted, easy-to-use financial charting package. Track and visualize the stock price of any company over a specific period of time using charting (such as Candlestick, OHLC, HiLo, and more) and range tools. The component comes with a lot of features such as zooming, panning, tooltip, crosshair, trackball, period selector, range selector, and events to make the stock charts more interactive.
Why choose Syncfusion ASP.NET Core Stock Chart?
High performance
Several data rendering optimizations have been used to achieve the best possible efficiency when plotting large amounts of data and managing high-frequency, real-time data.
Elegant animation
The Stock Chart for ASP.NET Core provides fluid animation to present data with smooth transitions.
Interactive stock chart
The tooltip and crosshair cursor allow users to interact with the chart and obtain detailed information about data points.
Stock events
Visualize stock events to display many types of market events on the chart.
Admirable feature set
The ASP.NET Core Stock Chart supports zooming and panning, multiple series, period selector, range selector, trendlines, and indicators.
Adapts to any resolution
Stock Chart has a highly responsive layout and an optimized design for desktops, touchscreens, and phones. It works well on all mobile phones that use iOS, Android, or Windows OS.
Attractive, customizable themes
Cutting-edge design with several built-in themes, such as Fluent, Tailwind CSS, Bootstrap, Material, and Fabric. Utilize the online Theme Studio tool to customize themes of Stock Chart easily.
Globalization and localization
Enable users from different locales to use the control by formatting dates, currency, and numbering to suit preferences.
ASP.NET Core Stock Chart Code Example
Easily get started with the ASP.NET Core Stock Chart using a few simple lines of C# code as demonstrated below. Also explore our ASP.NET Core Stock Chart Example that shows you how to render and configure the stock chart.
@using Syncfusion.EJ2
@section ControlsSection{

    <div class="control-section" align="center">
        <div id="container">
            <ejs-stockchart id="stockchartdefault" load="stockload" title="AAPL Stock Price" tooltipRender="tooltipRender">
                <e-stockchart-chartarea>
                    <e-stockchartarea-border width="0"></e-stockchartarea-border>
                </e-stockchart-chartarea>
                <e-stockchart-primaryxaxis>
                    <e-majorgridlines width="0"></e-majorgridlines>
                    <e-crosshairtooltip enable="true"></e-crosshairtooltip>
                </e-stockchart-primaryxaxis>
                <e-stockchart-primaryyaxis>
                    <e-linestyle width="0"></e-linestyle>
                    <e-majorticklines width="0"></e-majorticklines>
                </e-stockchart-primaryyaxis>
                <e-stockchart-tooltipsettings enable="true"></e-stockchart-tooltipsettings>
                <e-stockchart-crosshairsettings enable="true"></e-stockchart-crosshairsettings>
                <e-stockchart-series-collection>
                    <e-stockchart-series type='Candle'> </e-stockchart-series>
                </e-stockchart-series-collection>
            </ejs-stockchart>
        </div>
    </div>
    <script src="~/scripts/chart/indicator-data.js"></script>
    <script>
        var data = chartData;
        function stockload(args) {

            args.stockChart.series[0].dataSource = data;
        }

        function tooltipRender(args) {
            if (args.text.split('<br/>')[4]) {
                let target = parseFloat(args.text.split('<br/>')[4].split('<b>')[1].split('</b>')[0]);
                let value = (target / 100000000).toFixed(1) + 'B';
                args.text = args.text.replace(args.text.split('<br/>')[4].split('<b>')[1].split('</b>')[0], value);
            }

        }
    </script>
}
using System;
using System.Collections.Generic;
using System.Linq;
using System.Threading.Tasks;
using Microsoft.AspNetCore.Mvc;
namespace EJ2CoreSampleBrowser.Controllers.StockChart
{
public partial class StockChartController : Controller
{
public IActionResult Default()
{
return View();
}
}
}Interactive Chart
The end-user experience is greatly enhanced by including a set of interactive features such as zooming, and panning, crosshair, trackball, events, and selection..


Candlestick with volume
ASP.NET Core Candlestick Chart allows analyzing both price action and volume at a glance.
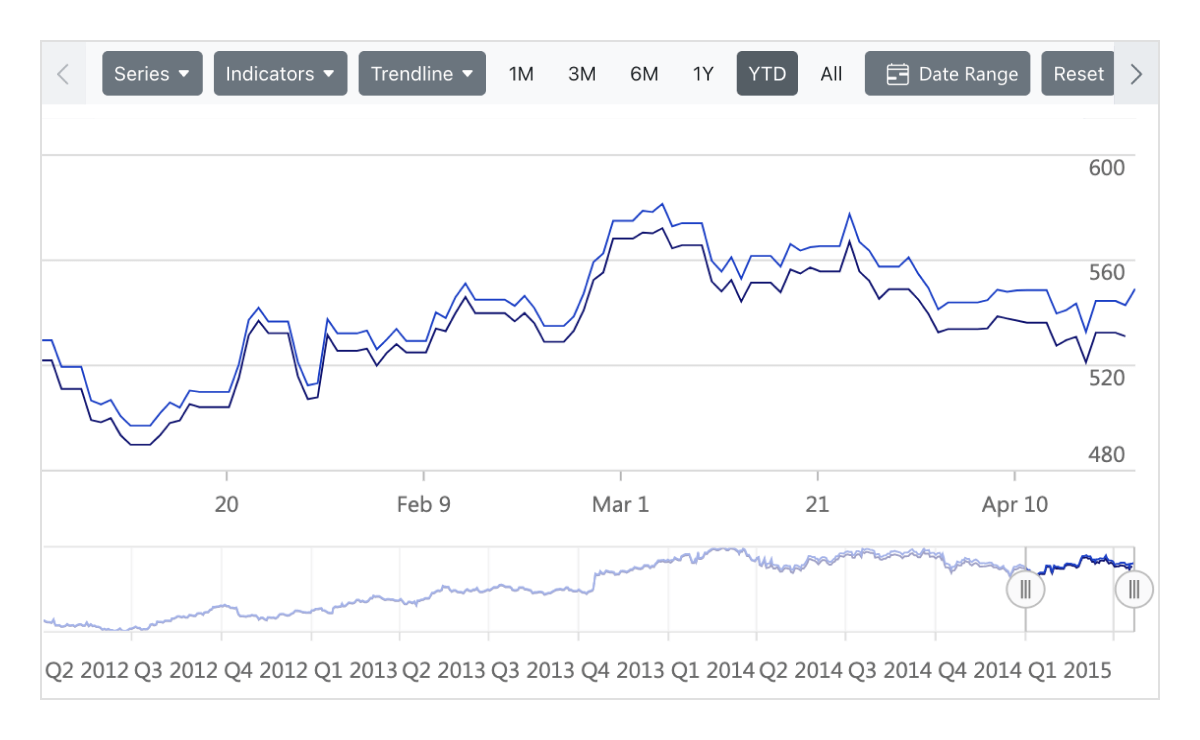
Multiple series
Plot multiple series in a single chart to compare different stock values. Enabling a legend and a tooltip gives more information about an individual series.

Plot band
Draw special attention to any region of the chart or graph with the help of strip lines.
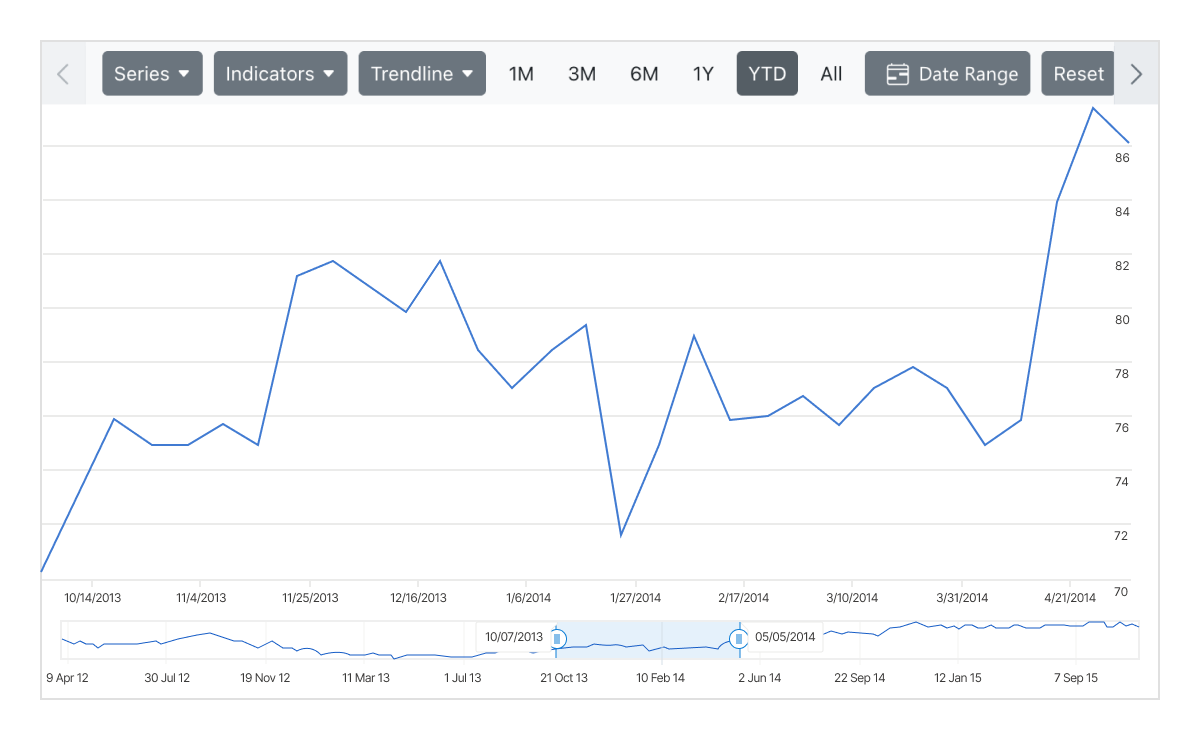
Range selector
Use the range selector to filter a date range for data that needs to be visualized.


Period selector
Use the period selector to choose a range of data points at predetermined intervals with a single click.
Series type
Visualize data using different series types like candle, OHLC, HiLo, line, spline, area, and spline area. The series type can be changed using the series options in the period selector.

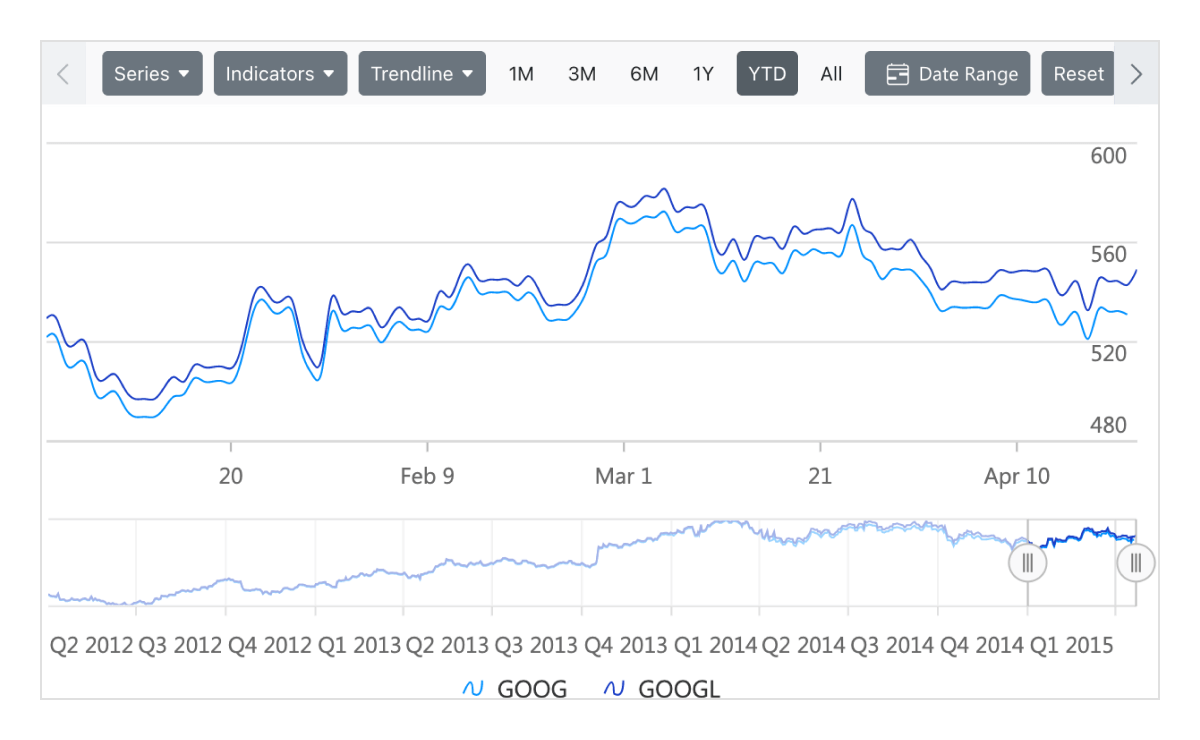
Legend
Legends provide additional information helpful in identifying individual data or series in a stock chart.
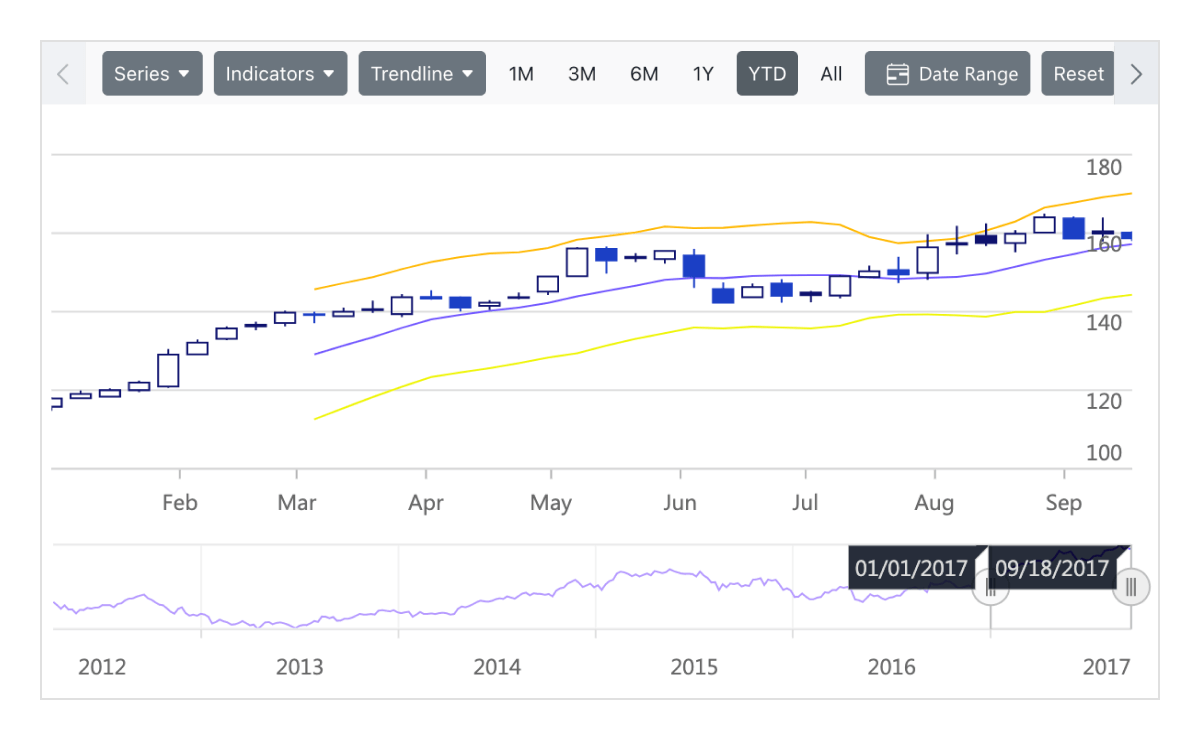
Indicators
Use technical indicators to analyze the past and predict the future market trends based on historic price, volume, or open interest. The Asp Net.Core Stock Chart supports 10 different types of indicators. You can add these indicators to a stock chart using the indicator option in the period selector.
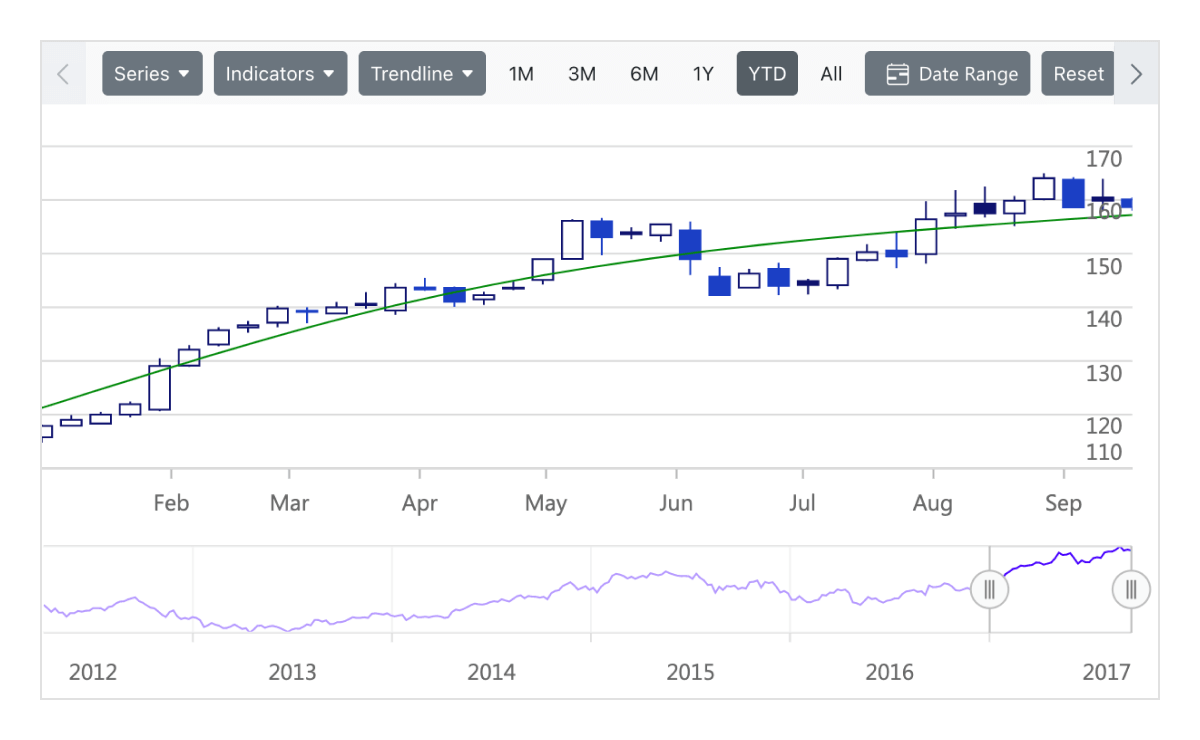
Trendlines
Predict future trends with predetermined data for any measurement such as the stock market or target revenue with the help of trendlines. You can add trendlines to a stock chart using the trendlines options in the period selector.
Print and Export
Export ASP.NET Core Stock Chart to PDF documents or to image formats such as SVG, PNG, and JPEG as well as export chart data to XLSX and CSV formats in the client-side. Print the rendered stock charts and graphs directly from the browser.

Axis type
Visualize data using different axis types like numeric, logarithmic, date-time, and date-time category. And this chart’s axis elements can be customized further to make an axis more readable.
Accessibility

Keyboard navigation
Every element in ASP.NET Core Stock Charts is keyboard accessible. Major features like tooltip, trackball, legend, collapse, zoom, and pan can be used through keyboard commands alone. No mouse interaction is required. This helps in creating highly accessible applications.

Screen reader
The ASP.NET Core Stock Chart view has complete WAI-ARIA accessibility support. The Stock Chart UI includes high-contrast visual elements that help visually impaired people to have the best viewing experience. Also, valid UI descriptions are easily accessible through assistive technologies such as screen readers.

Right to left (RTL)
Right-to-left rendering allows displaying the text and layout of the Stock Chart from right to left. This improves the user experience and accessibility for RTL languages.
Other supported frameworks
The Stock Chart is available for the Blazor, React, Angular, JavaScript, Vue, and ASP.NET MVC frameworks. Explore its platform-specific options through the following links:


Supported browsers
The ASP.NET Core Stock Chart works well with all modern web browsers, including Chrome, Firefox, Edge, Safari, and Opera.
Not sure how to create your first ASP.NET Core Stock Chart? Our documentation can help.
I’d love to read it now140+ ASP.NET CORE UI CONTROLS
ALL CONTROLS
SMART COMPONENTS
GRIDS
DATA VISUALIZATION
FILE VIEWERS & EDITORS
DROPDOWNS
NAVIGATION
INPUTS
BUTTONS
NOTIFICATION
INTERACTIVE CHAT
Standalone UI SDKs
Integrate the DataGrid, Chart, Scheduler, Gantt, Rich Text Editor, File Manager, and Diagram UI components into applications to enable rich interaction and visualization, delivering a seamless user experience.
Document Solutions
Integrate the PDF Viewer, DOCX Editor, Spreadsheet Editor, and document-processing libraries into the ASP.NET Core applications to enable a smooth user experience.
Frequently Asked Questions
Why should you choose Syncfusion ASP.NET Core Stock Chart?
Visualize and analyze stock data with candlestick, OHLC, HiLo Chart.
Interact and explore stock charts with features such as period selector, range selector, zoom and pan, crosshair, tooltip, trackball, and more.
- Flexible UI customization of period and range selector with fluent APIs.
- One of the best ASP.NET Core Stock Chart in the market that offers feature-rich UI to interact with the software.
10 Technical indicators and 4+ Financial Chart types with elegant animation.
Simple configuration and API.
- Supports all modern browsers.
- Mobile-touch friendly and responsive.
Expansive learning resources such as demos and documentation to learn quickly and get started with ASP.NET Core Stock Chart.
Where can I find the Syncfusion ASP.NET Core Stock Chart demo?
You can find our ASP.NET Core Stock Chart demo, which demonstrates how to render and configure the Stock Chart.
Can I download and utilize the Syncfusion ASP.NET Core Stock Chart for free?
No, this is a commercial product and requires a paid license. However, a free community license is also available for companies and individuals whose organizations have less than $1 million USD in annual gross revenue, 5 or fewer developers, and 10 or fewer total employees.
How do I get started with Syncfusion ASP.NET Core Stock Chart?
A good place to start would be our comprehensive getting started documentation.
Our Customers Love Us
Having an excellent set of tools and a great support team, Syncfusion® reduces customers’ development time.Here are some of their experiences.

Great and flexible controls to build web applications
Controls meet specifications to develop web applications (ASP.NET MVC and Core in my case) and provide a lot of features to develop world-class software. There are options for other frameworks/platforms. Support is excellent which makes me feel very confident when facing trouble, they provide answers in 24 hours. Support team will make a big effort to solve your issues and they are ready for a phone call and to remotely connect to your PC.

Jorge M,

Founder and Software Architect, Small-Business
Great tool, saves alot of time, and great support
Syncfusion really makes it simple to implement features that would take a ton of time and effort to create. When you're building your site, the UI can take a ton of time away from building the core app. With Syncfusion's tools it reduces that effort significantly so you can get back to building the core elements.

Walter T,
Founder, Small-Business
See Real Success Stories
Developers around the world trust Syncfusion’s Essential Studio to simplify complex projects and speed up delivery. With a vast library of UI controls, powerful SDKs, and reliable support, Essential Studio helps teams build enterprise-ready applications with confidence.
Read Our Customer StoriesIndustry
Software development
75% Cost reduction
50% Faster development
Industry
Utilities (oil and gas)
450+ hours saved
Streamlined processes and hours of development effort saved.
Advanced, flexible features
Empowered users through robust and versatile functionality.
Industry
Software and technology
1000+ of hours saved
Accelerated development with enterprise-ready UI components.
Efficient file management
Streamlined workflows with document libraries without building them from scratch.
Industry
Software and technology
2 Years of delay avoided
Two years of delays prevented with proactive planning.
On-time delivery
Projects delivered on schedule using trusted controls.
Industry
IT services and IT consulting
Improved performance
Large datasets handled with easy customization and quick debugging.
Highly customizable
Plug-and-play controls with quick template integration.
Industry
Professional services
Instant access
Quick availability of features and resources.
Reduced dependencies
Fewer dependencies for faster development.
Rated by users across the globe
Syncfusion ASP.NET Core Stock Chart Resources


UI Kits
 Figma Download
Figma Download
Awards
Greatness—it’s one thing to say you have it, but it means more when others recognize it. Syncfusion® is proud to hold the following industry awards.

