


Overview
The Syncfusion React Diagram component helps developers build interactive flowcharts, organizational charts, BPMN diagrams, UML diagrams, and mind maps in React applications. It provides drag-and-drop editing, automatic layouts, data binding, connector routing, zooming, printing, and export features for building enterprise diagramming applications.
Why choose the Syncfusion React Diagram component?
Automatic layout
Automatically arrange flowcharts, organizational charts, and hierarchical diagrams with built-in layout algorithms.
Seamless data binding
Generate React organizational charts and flowcharts directly from hierarchical or relational data sources using built-in data binding.
AI-Assisted Development
Build interactive diagramming experiences faster with the Agentic UI Builder and Syncfusion Agent Skills. Generate flowcharts, node layouts, connectors, and visual workflows with minimal manual effort.
Adapts to any resolution
Diagram has a highly responsive layout and an optimized design for desktops, tablets, and phones. It works well on all mobile phones that use iOS, Android, or Windows OS.
Gallery of reusable symbols
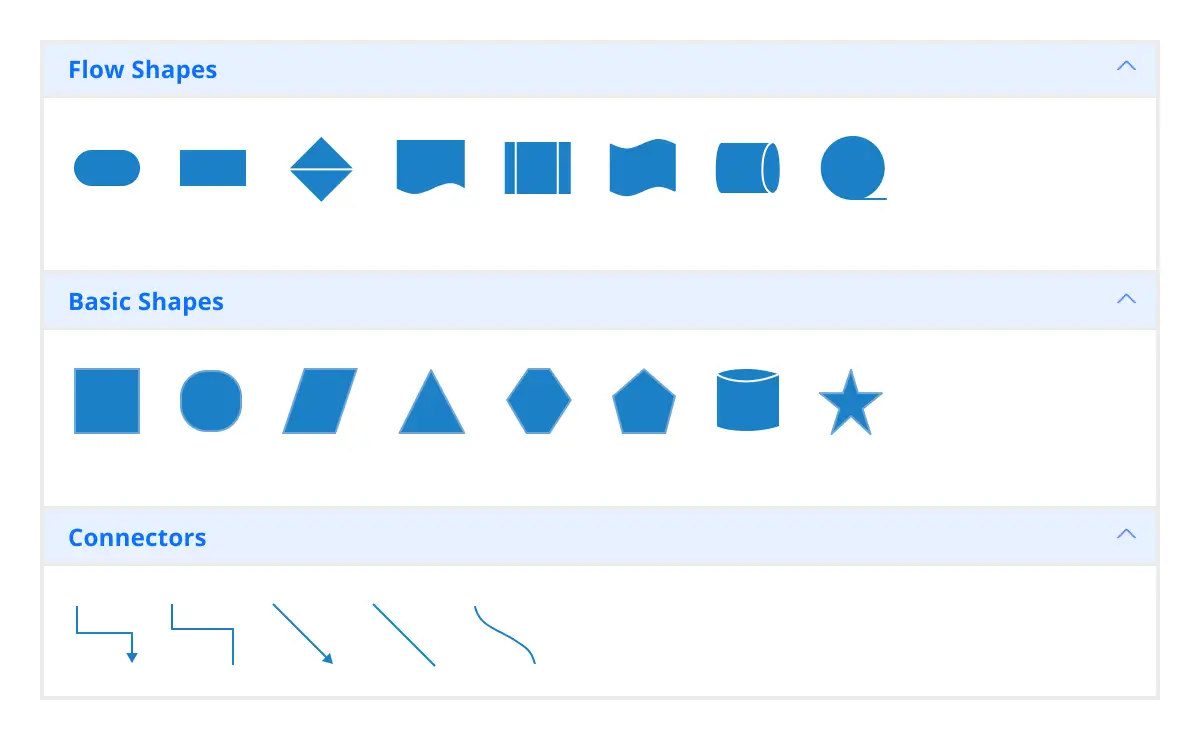
The symbol palette displays a collection of palettes. A palette displays a set of nodes and connectors that can be dragged and dropped into the Diagram.
Globalization and localization
Enable users from different locales to use the component by formatting dates, currencies, and numbering to suit preferences.
React Diagram Use Cases
Build powerful diagramming and visualization applications using the Syncfusion React Diagram. It supports real-world scenarios such as diagram builder, mind map maker, org chart creator, BPMN editor, logic circuit diagram, floor planner.
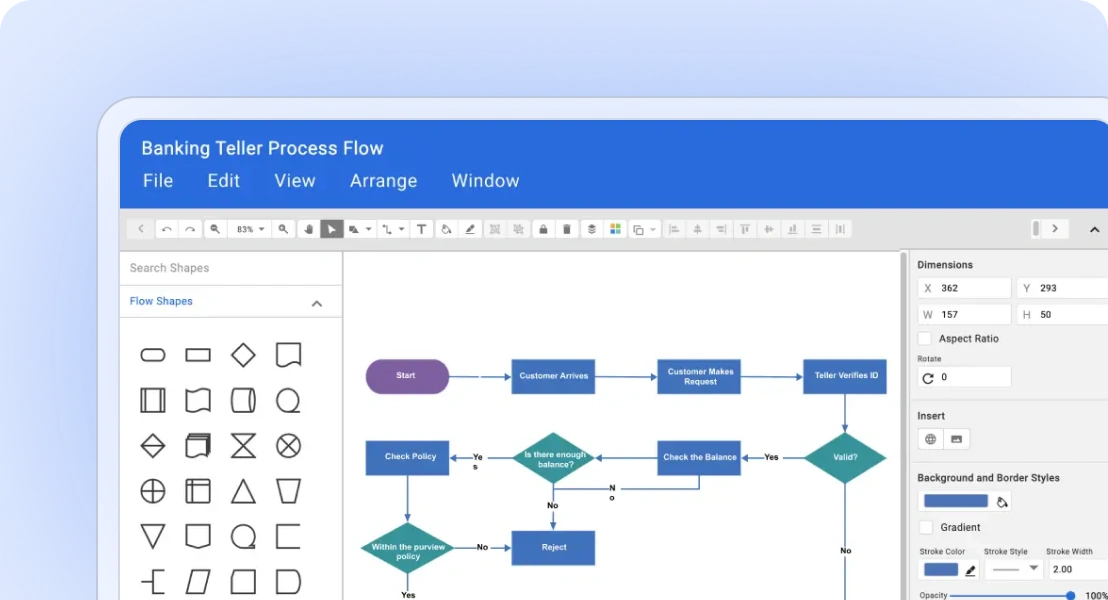
Diagram builder
Diagram Builder is a web application which is used to create the diagrams like Flow Chart, Organizational Chart and Mind Map diagrams.
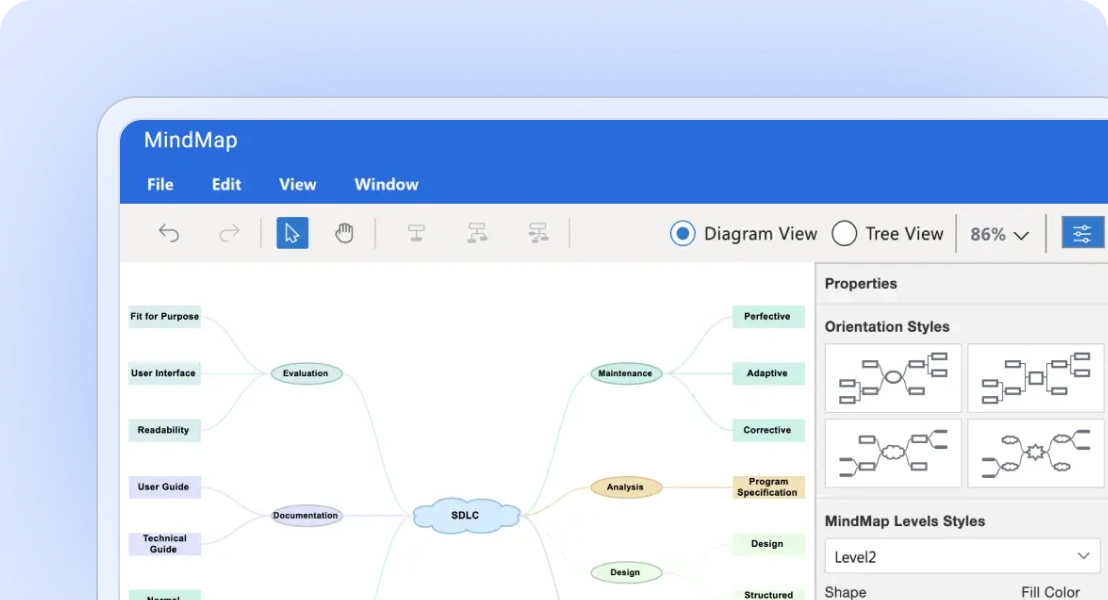
Mind map maker
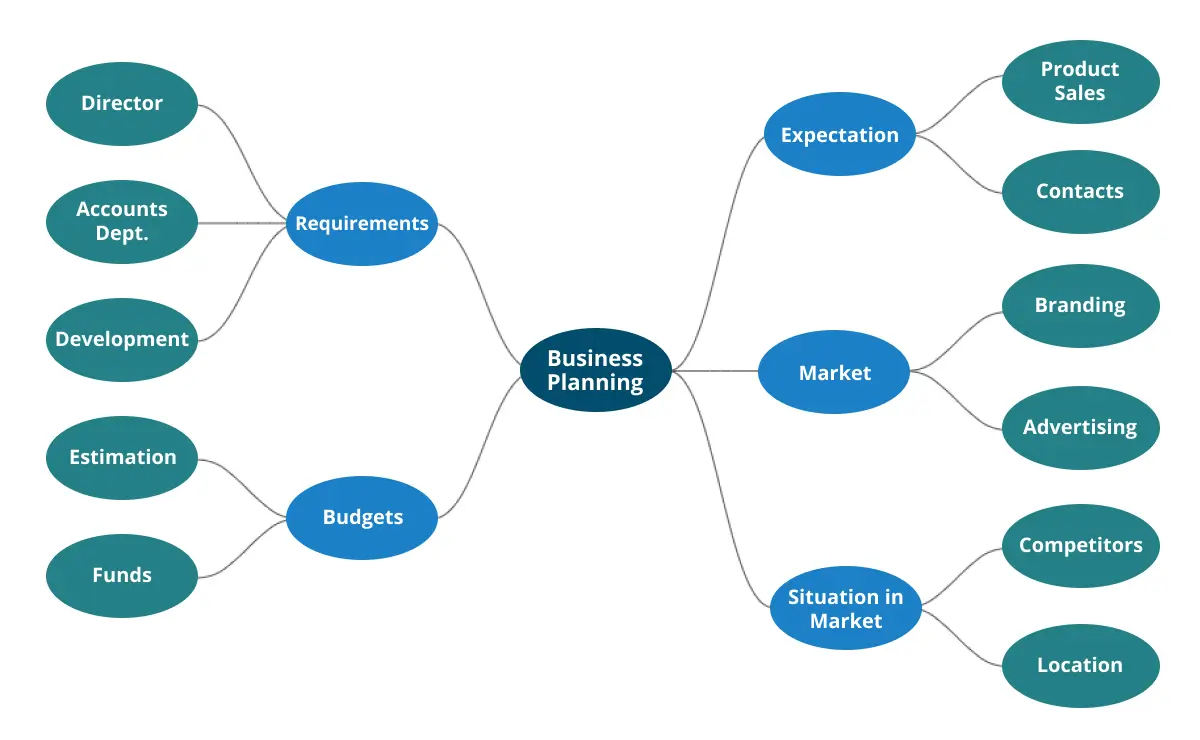
A mind map, a type of spider diagram, is a visual tool that helps you discover the relationship between each concept and structured information.
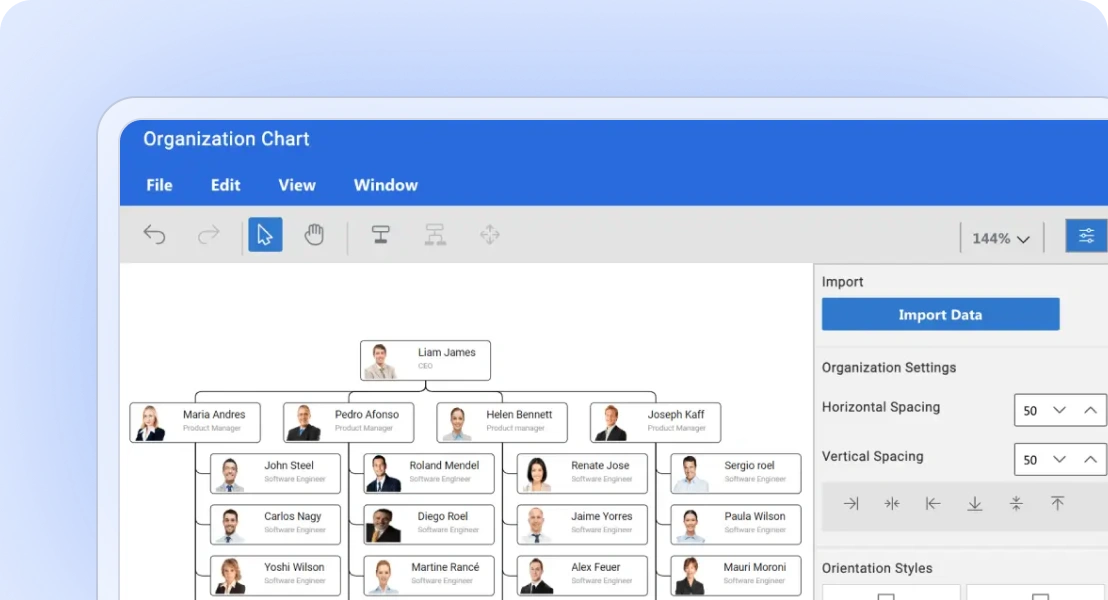
Org chart creator
An organizational chart is a diagram that visually conveys a company’s internal structure by detailing the roles, responsibilities, and relationships between individuals within an entity.
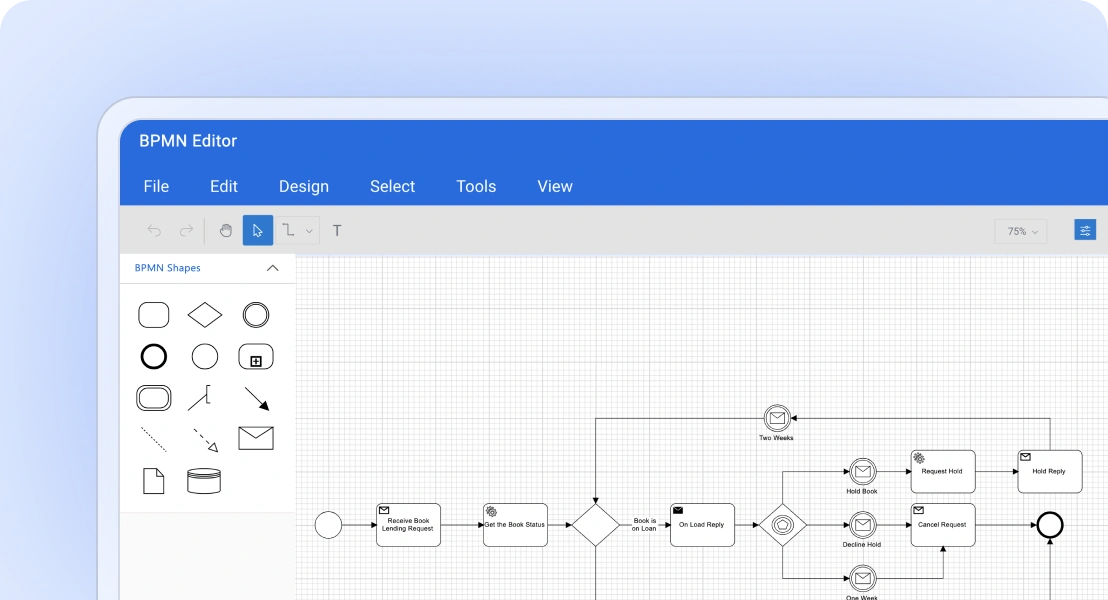
BPMN editor
Create your own business process model, that is a graphical representation and share it across your organization and industry to improve your business process.
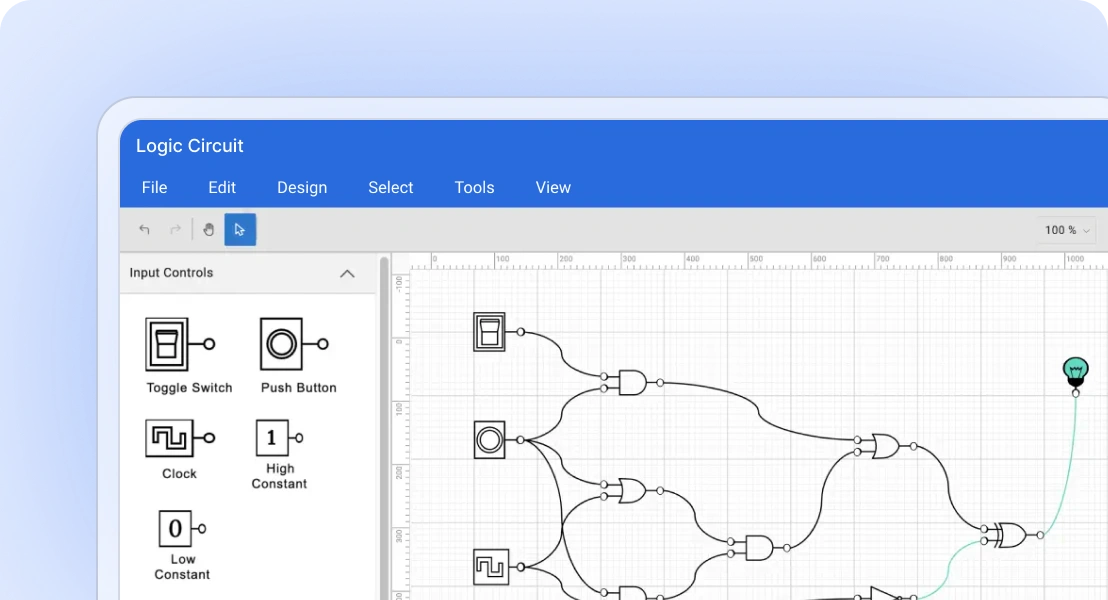
Logic circuit designer
Design and simulate digital logic circuits using a wide range of logic gates, input and output components to better visualize and understand how it works, and share your design with others.
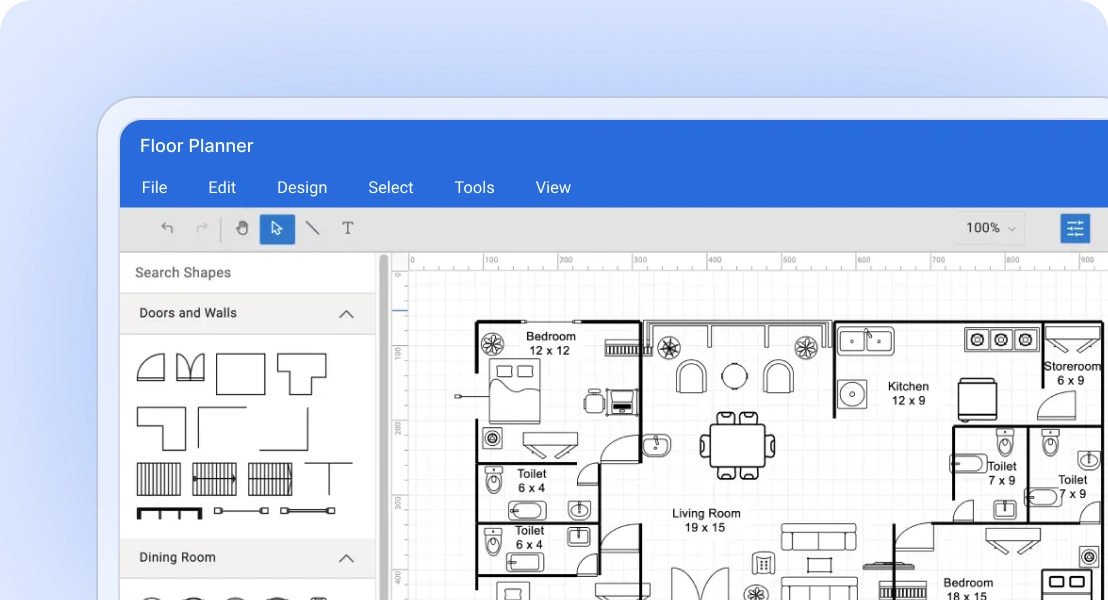
Floor planner
Design and plan the layout of a floor or building, including the placement of walls, doors, windows, furniture, and other objects.
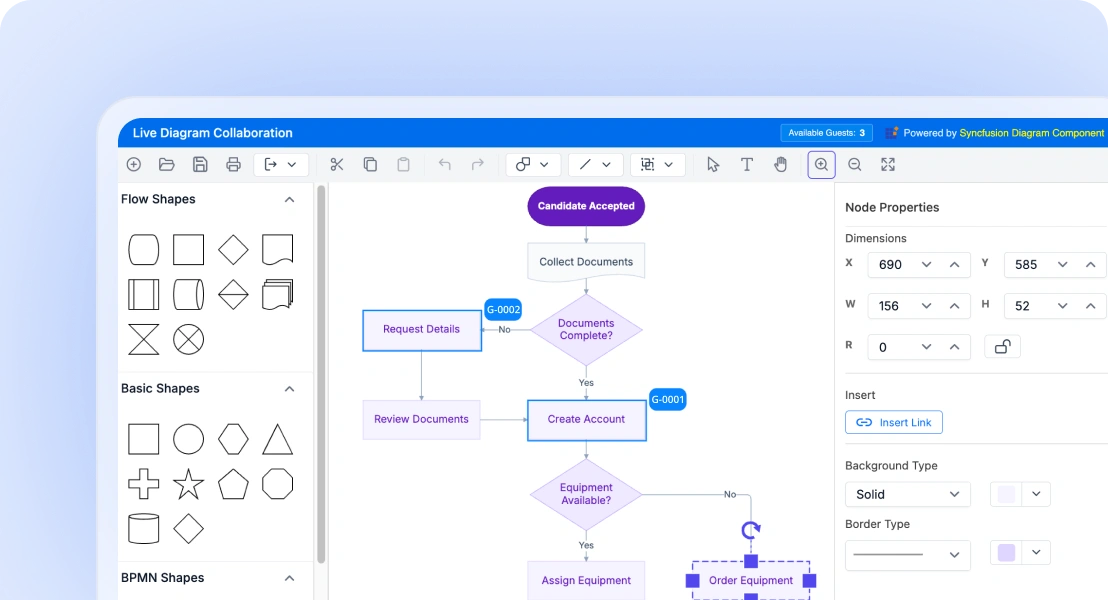
Collaborative Diagram
Create and collaborate on flowcharts and mind maps in real time with multi-user editing, live updates, and peer selection visualization.
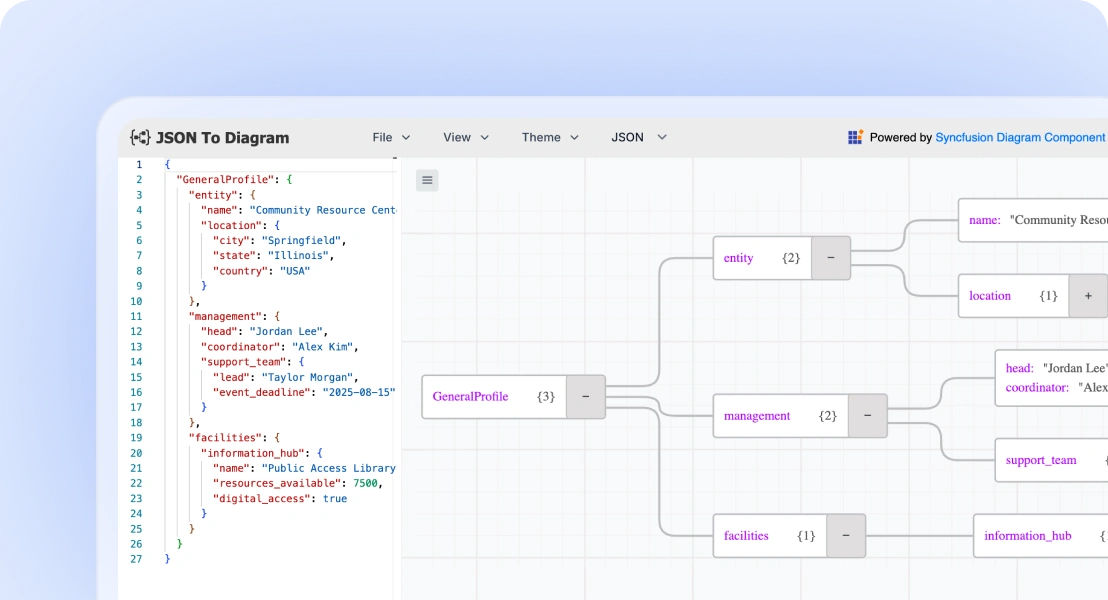
JSON/XML to Diagram Visualizer
JSON and XML to Diagram Visualizer is a web application designed as a powerful visualization tool for JSON and XML data formats. It transforms complex structured data into intuitive, tree-based diagram layout.
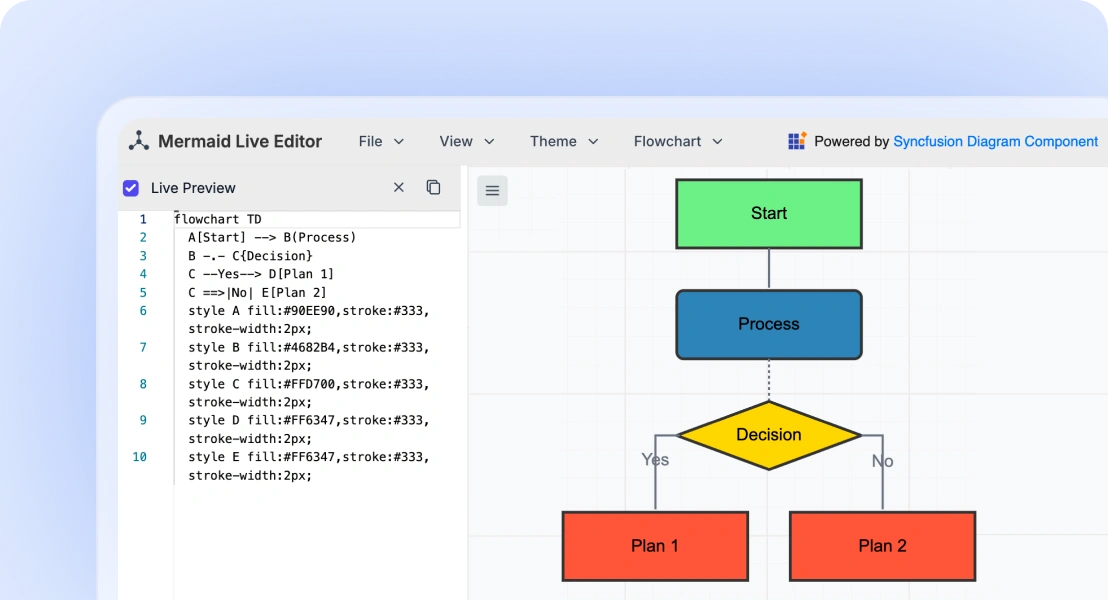
Mermaid Editor
An interactive Mermaid live editor that lets users write or paste Mermaid syntax and instantly generate visual diagrams with real-time preview and export capabilities.
AI-ready Diagrams for effortless visualization
Diagram works out of the box with AI. Easily enhance it using text-to-diagram generation powered by your preferred AI tools. Create, edit, and understand complex diagrams faster than ever.
-
Text-to-diagram: Turn natural language into flowcharts, mind maps, or sequence diagrams with no manual drawing needed.
- See how to create diagrams with text
React Diagram Code Example
Easily get started with the React Diagram using a few simple lines of TSX code example as demonstrated below. Also explore our React Diagram Example that shows you how to render and configure a Diagram in React.
import { DiagramComponent } from '@syncfusion/ej2-react-diagrams';
function App() {
  return (<DiagramComponent id="container" width={"100%"} height={"500px"} />);
}
export default App;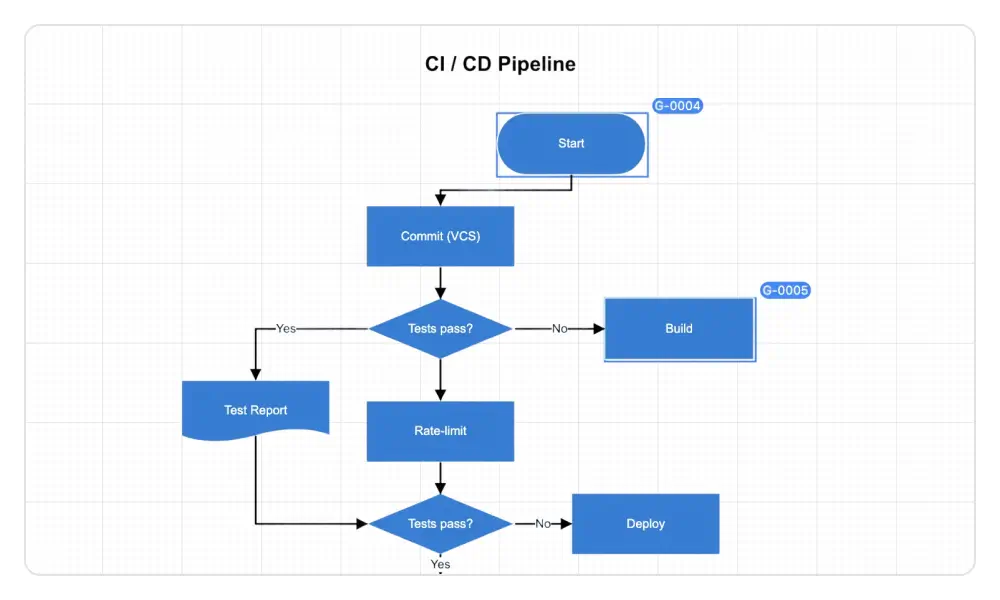
Real-time collaboration
Multiple users can edit the same diagram simultaneously and see live updates, improving teamwork and efficiency.
- User presence highlighting: Each element indicates who is currently interacting with it.
- Conflict handling: When multiple users edit the same element, the first user’s changes are applied, and the others are notified of the conflict.
Flowcharts
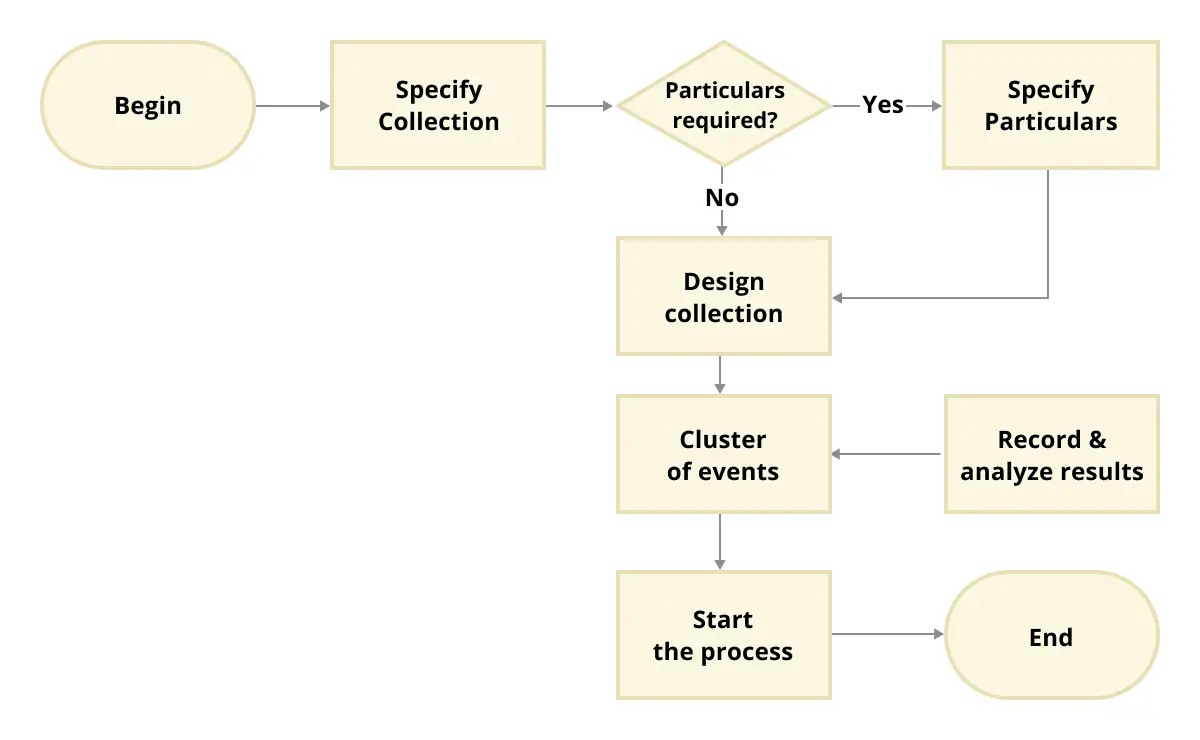
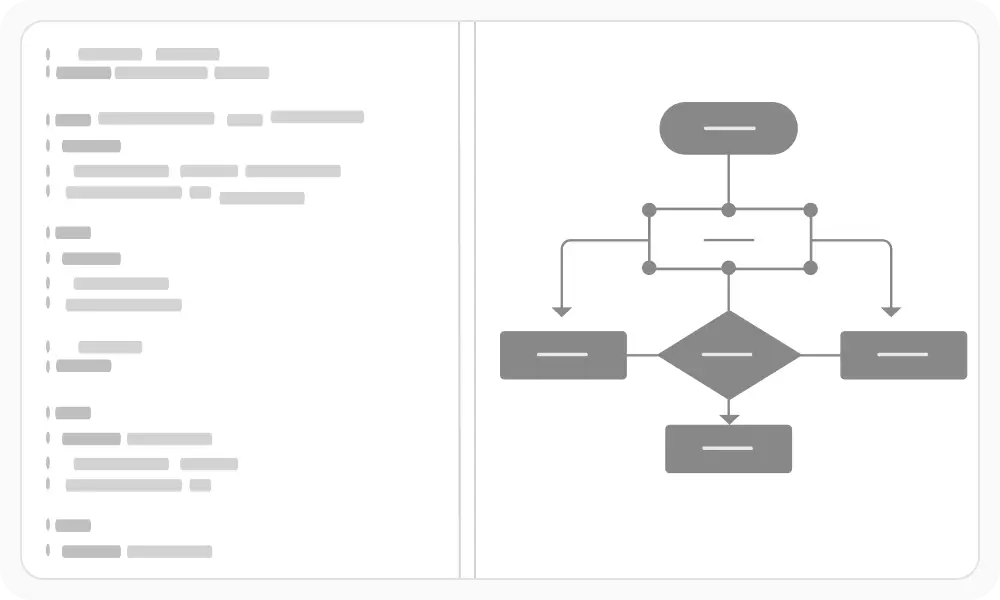
The React Diagram provides all the standard flowchart shapes as ready-made objects to build flowcharts, making it easy to add them to a diagram surface in a single call.
Organizational charts
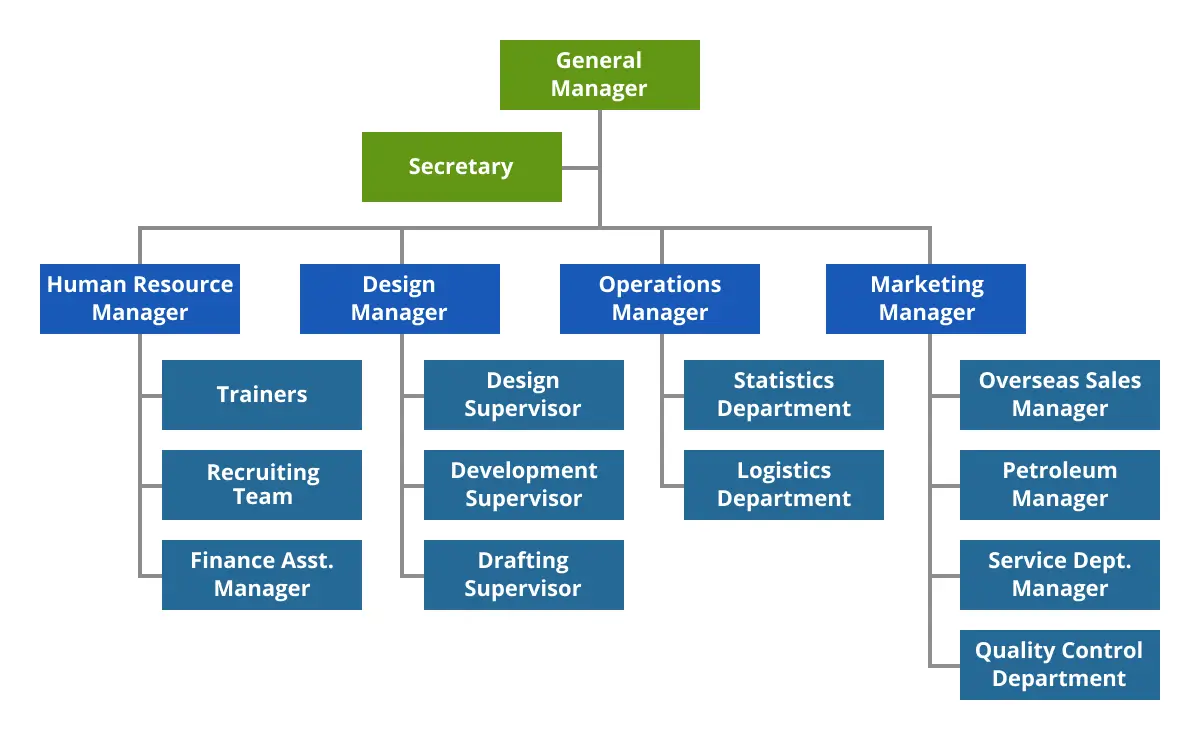
Arrange parent and child node positions automatically with a built-in layout algorithm specifically made for organizational charts.
Mind maps
A layout algorithm is also built into the component for mind map diagrams. Users can define which node should be at the center and which nodes should be placed around it on the diagram surface.
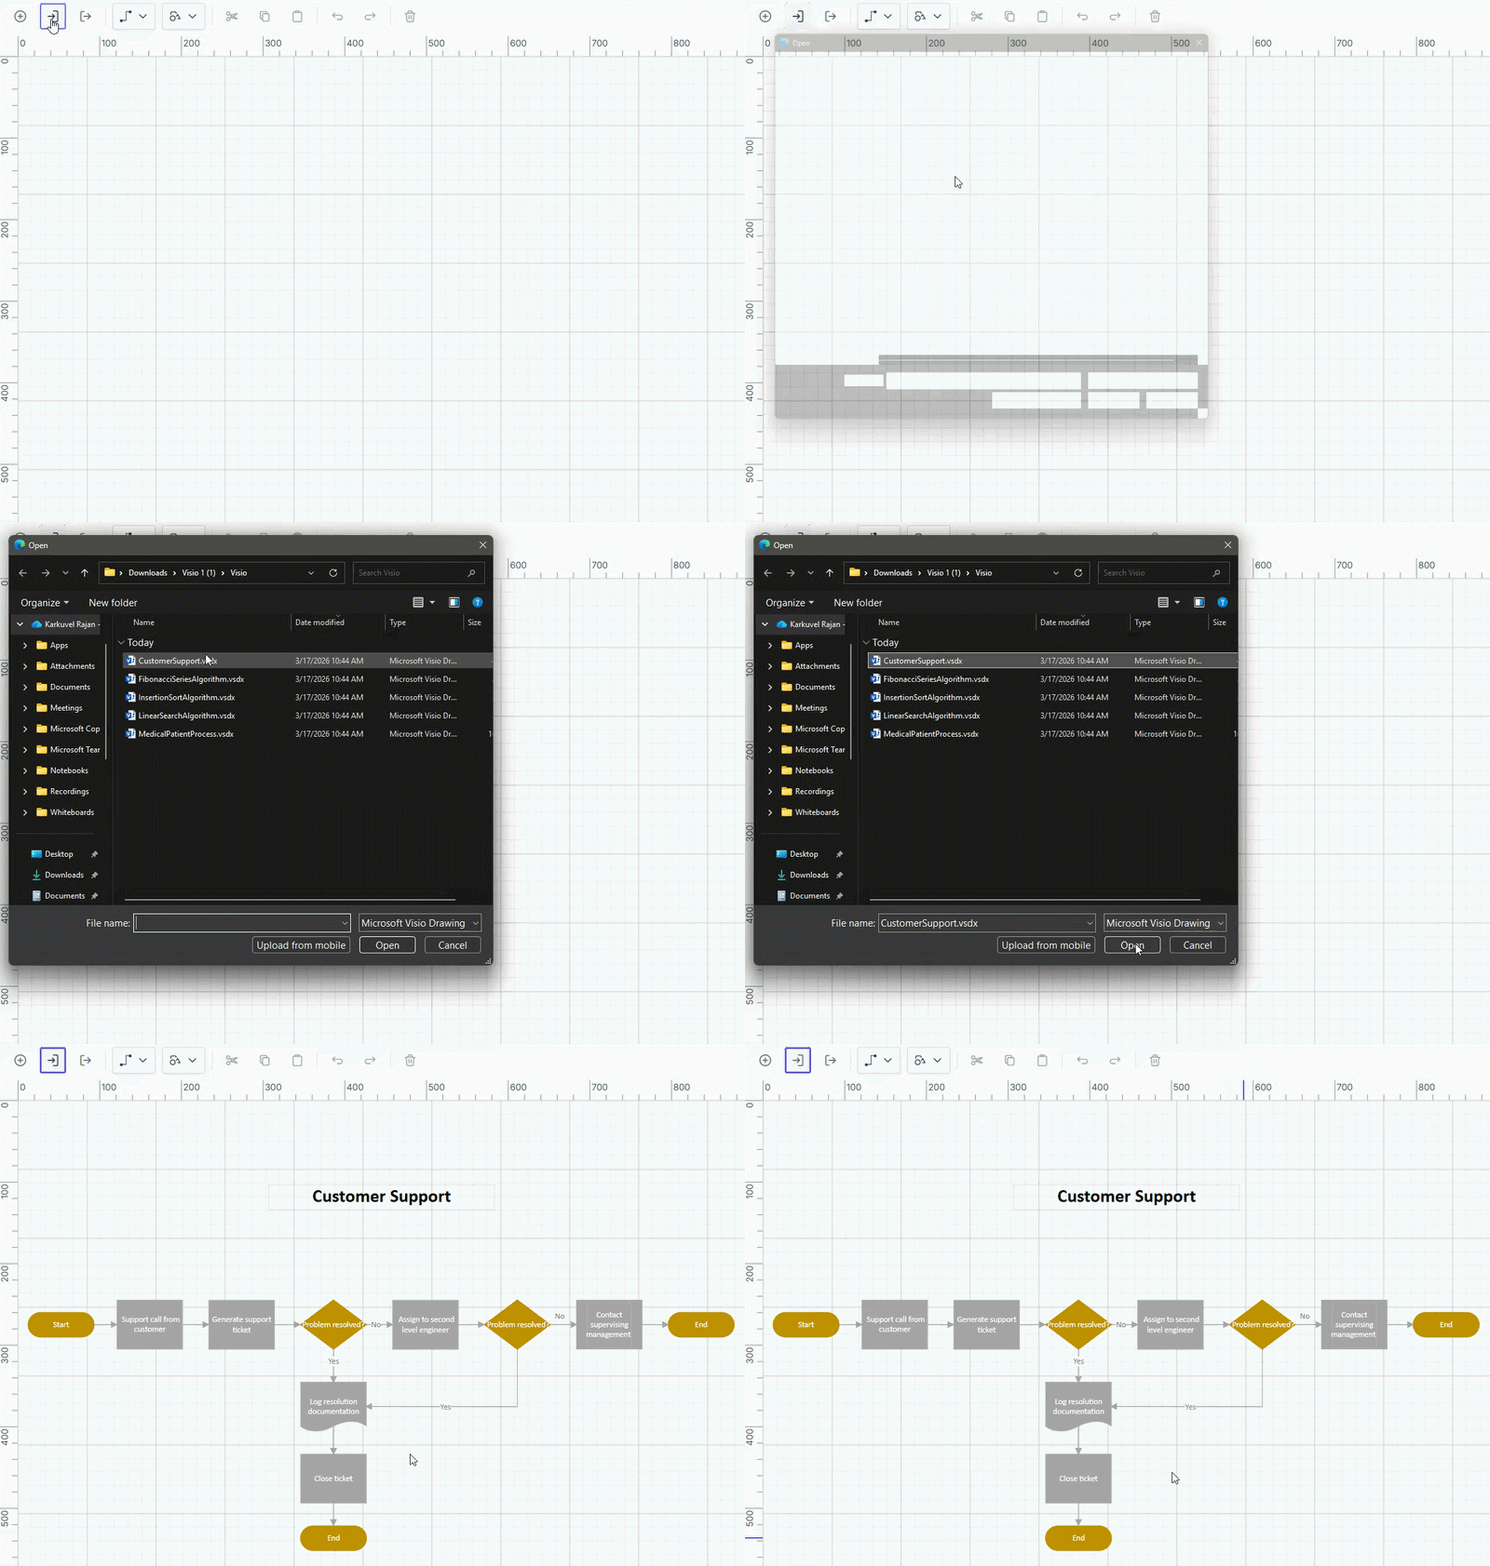
Seamless Visio integration
Import Microsoft Visio (.vsdx) files into the React Diagram and export diagrams back to Visio format, with support for flow shapes, basic shapes, groups, connectors, ports, and annotations.
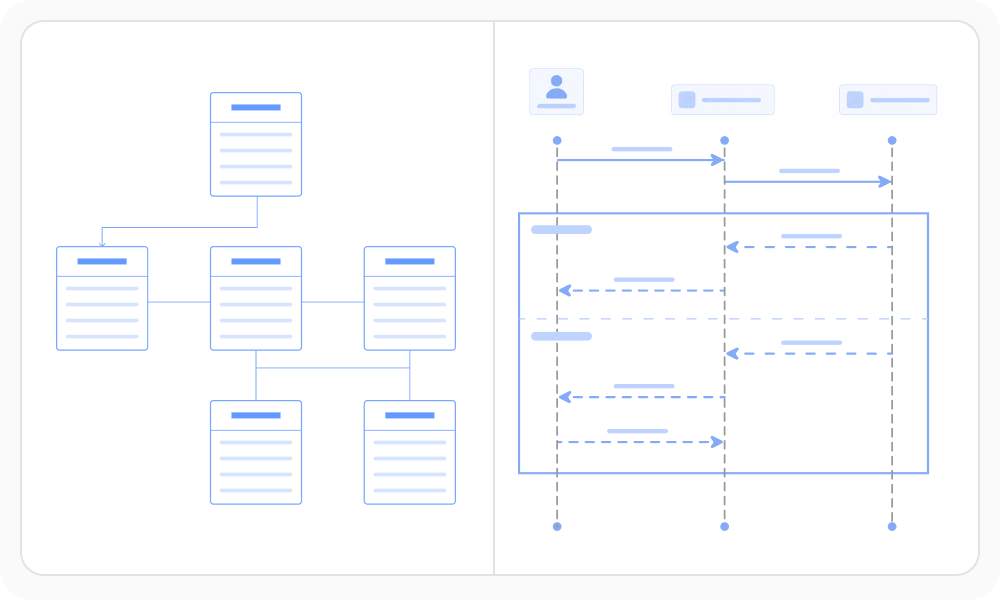
UML diagrams
Model common UML diagram types, including class, activity, and sequence diagrams, to visualize system structure and behavior.
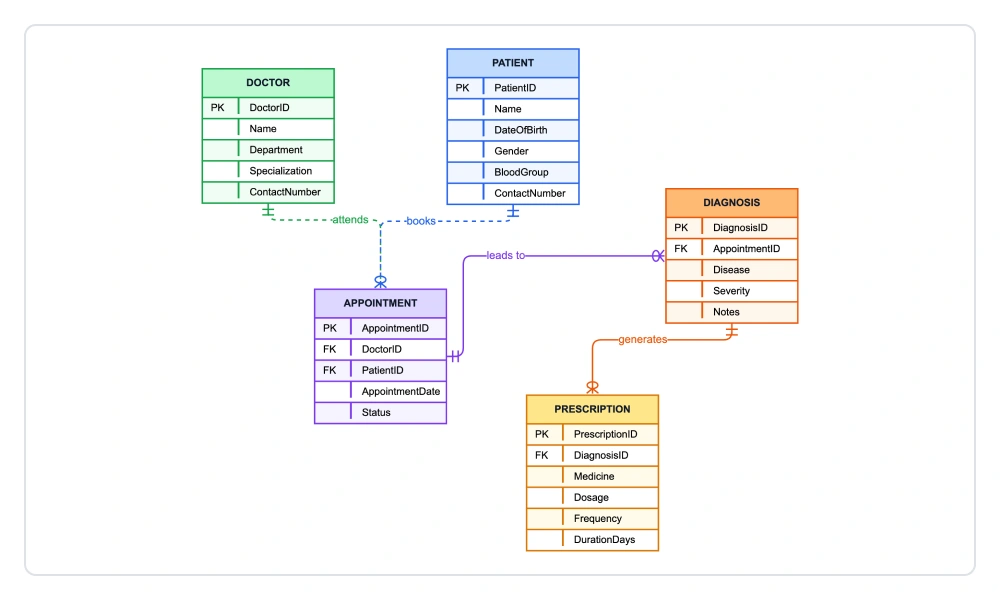
Entity-Relationship diagrams
Visualize database structures with entity-relationship (ER) diagrams. Define entities, attributes, and relationships, including primary keys, foreign keys, and cardinalities, to model data schemas accurately.
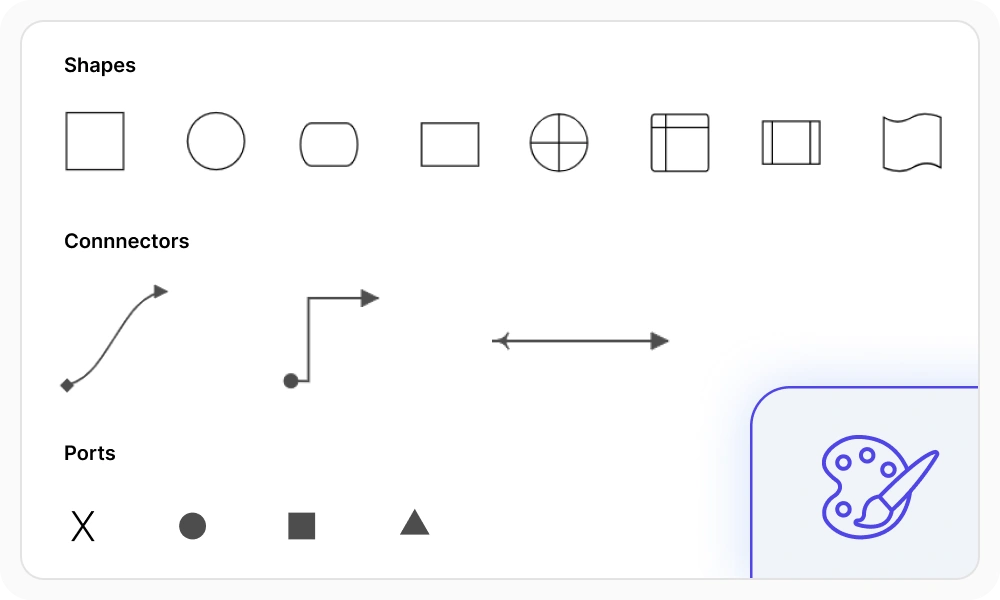
Shapes and connectors
Use a rich set of predefined shapes, including flowchart, BPMN, UML, and basic shapes. Connect them with customizable connectors and ports that define specific connection points to visually model relationships and processes.
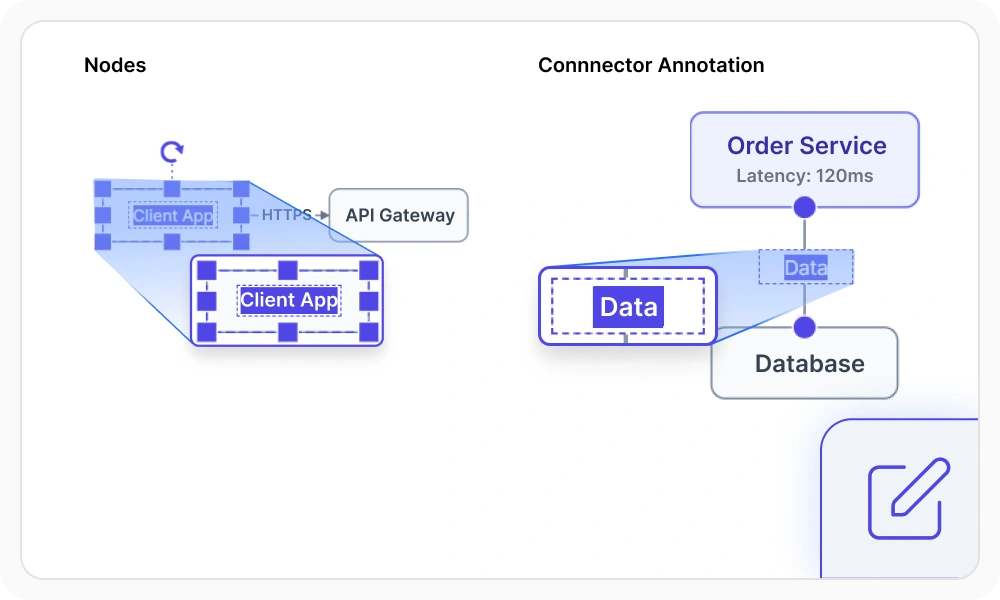
Annotations
Annotations are text labels displayed on nodes and connectors. Add, edit, align, and customize them to provide additional context within a diagram.
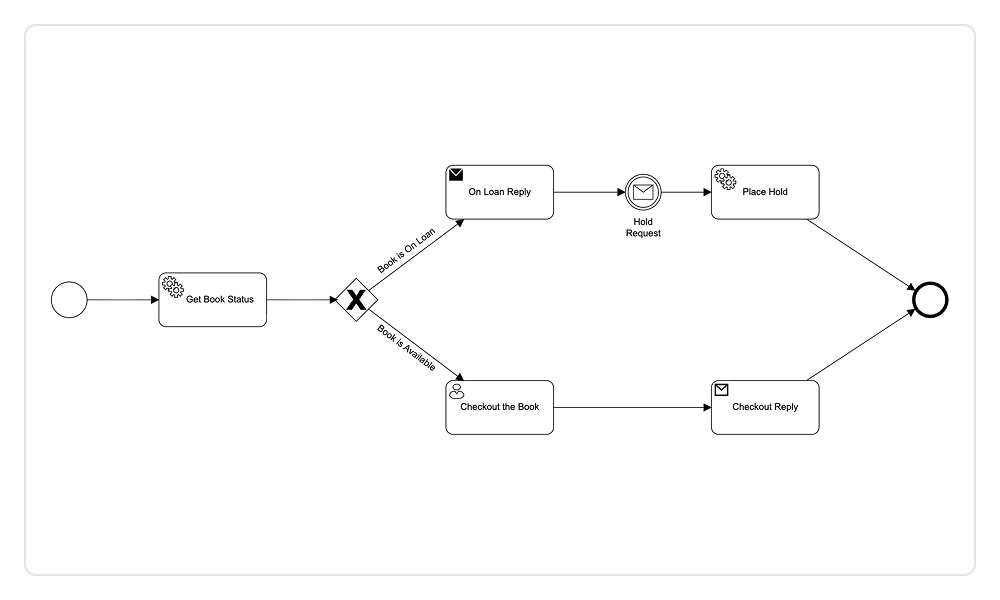
BPMN editor
The React Diagram includes standard Business Process Model and Notation (BPMN) shapes for visually modeling business processes.
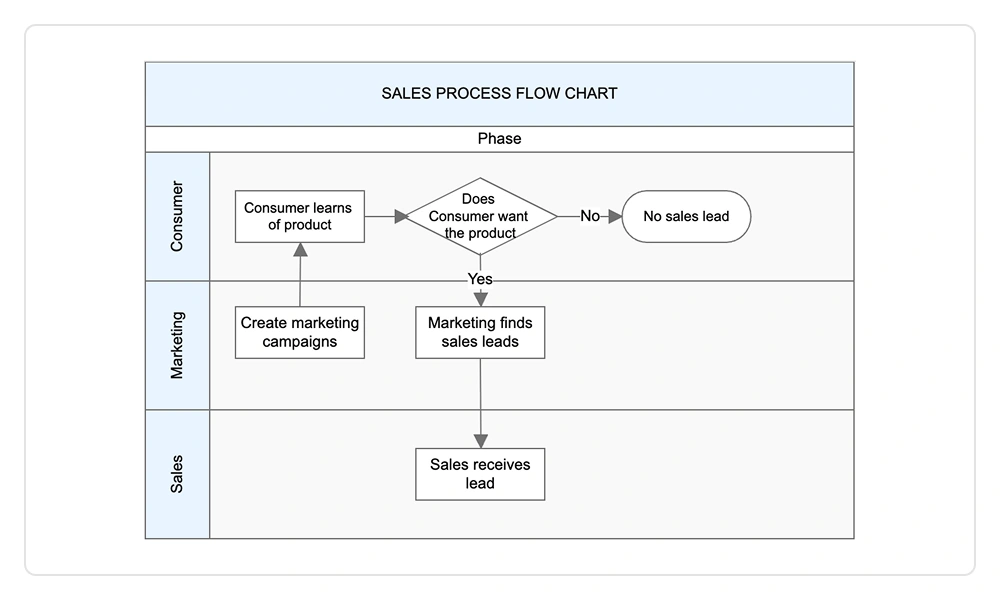
Swimlanes
The React Diagram supports swimlanes, which are visual elements that represent various components, activities, and responsibilities within a business process.
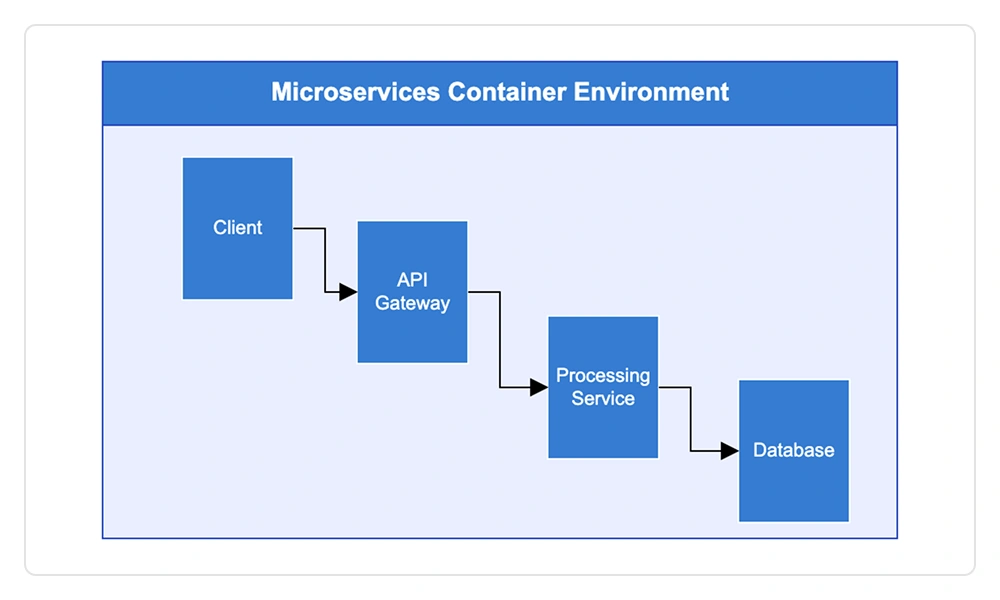
Containers
Containers organize related elements into clearly defined sections, supporting drag‑and‑drop interaction, flexible layouts, independent styling, and grouped event handling to improve UI clarity, consistency, and overall user experience.
Interactive features
Use interactive features to improve the editing experience of a React Diagram at runtime. Furthermore, easily edit a diagram using a mouse, touchscreen, or keyboard.

Select and drag
Select one or more nodes, connectors, or annotations and edit them using thumbs or handlers.

Resize
Users can resize a node in eight directions and lock a node’s aspect ratio to keep its shape. They can also resize multiple objects simultaneously.


Undo and redo
Undo and redo in the diagramming tools allow users to reverse or reapply actions such as moving, resizing, and creating elements.

Clipboard
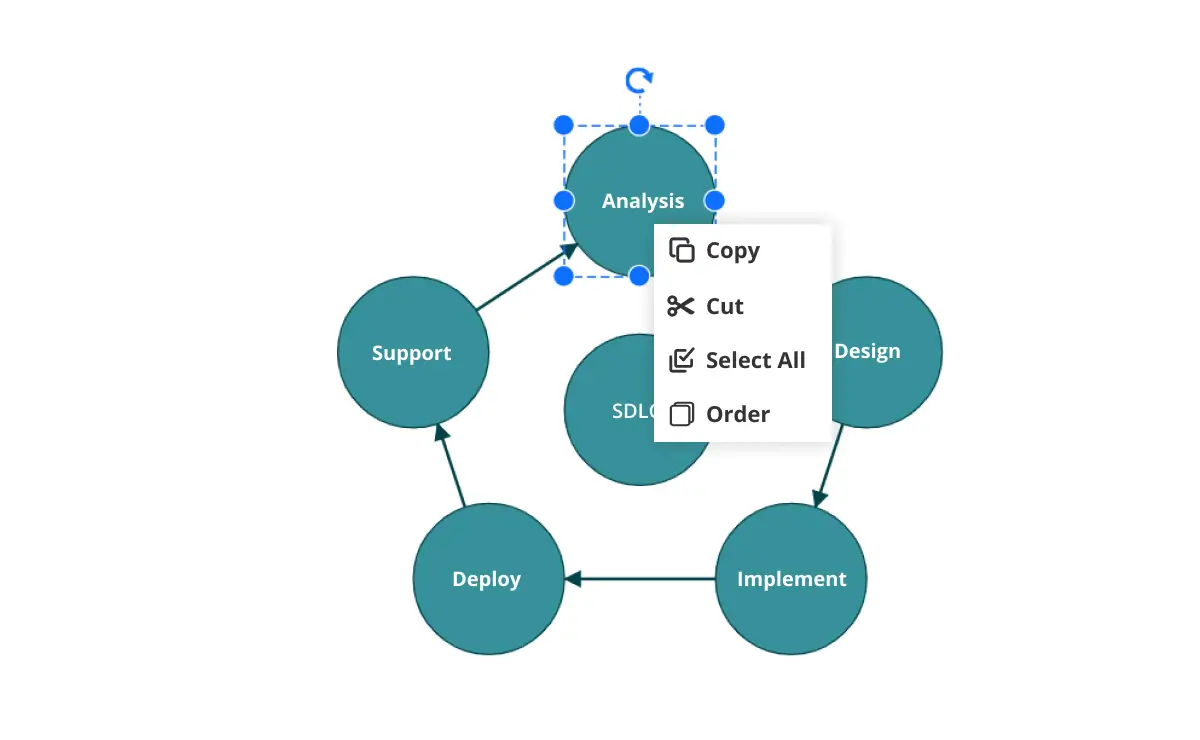
Cut, copy, paste, or duplicate selected objects within a diagram or across multiple diagrams.

Z-order
When multiple objects overlap, the z-order controls which object is at the top and which is at the bottom.

Snap
Precisely align nodes, connectors, and annotations while dragging just by snapping to the nearest gridlines or objects.

Grouping
Combine multiple nodes into a group and then interact with them as a single object. Nested groups are also possible with our React Diagram component.

Quick commands
Frequently used commands like delete, connect, and duplicate can be shown as buttons near a selector. This makes it easy for users to perform those operations quickly instead of searching for the correct buttons in a toolbar.
Alignment
Our React Diagram Library has predefined alignment commands that enable users to align the selected objects’ nodes and connectors with respect to the selection boundary.
Spacing commands
Spacing commands let users place selected objects on the Diagram at equal intervals.
Sizing commands
Use sizing commands to size selected nodes evenly relative to the first selected object.
Align commands
All the nodes or connectors in the selection list can be aligned to the left, right, or center horizontally, or aligned at the top, bottom, or middle vertically with respect to the selection boundary.
Automatic layout
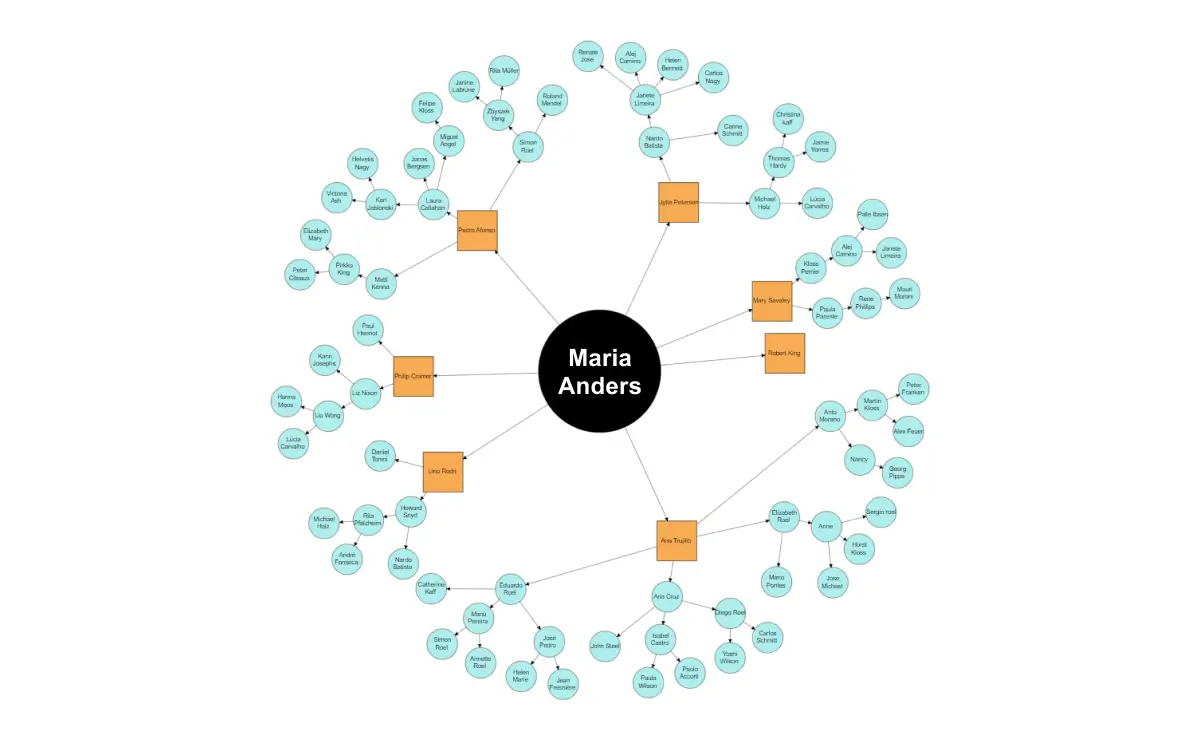
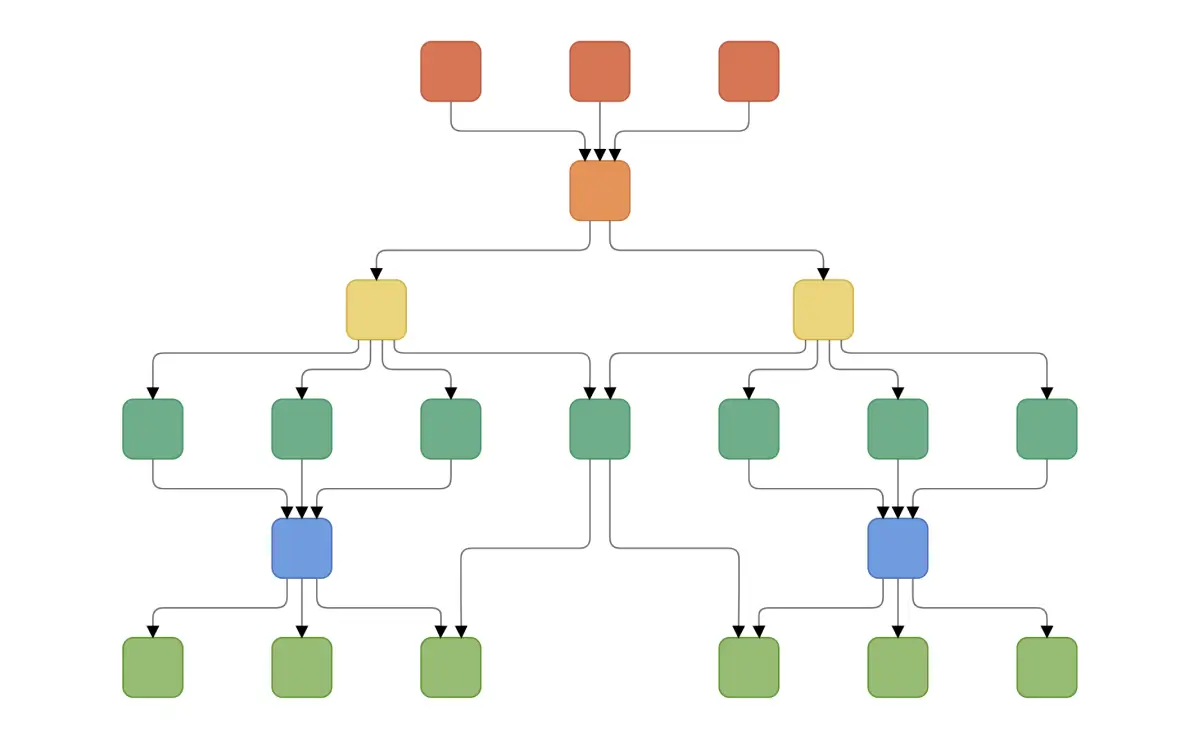
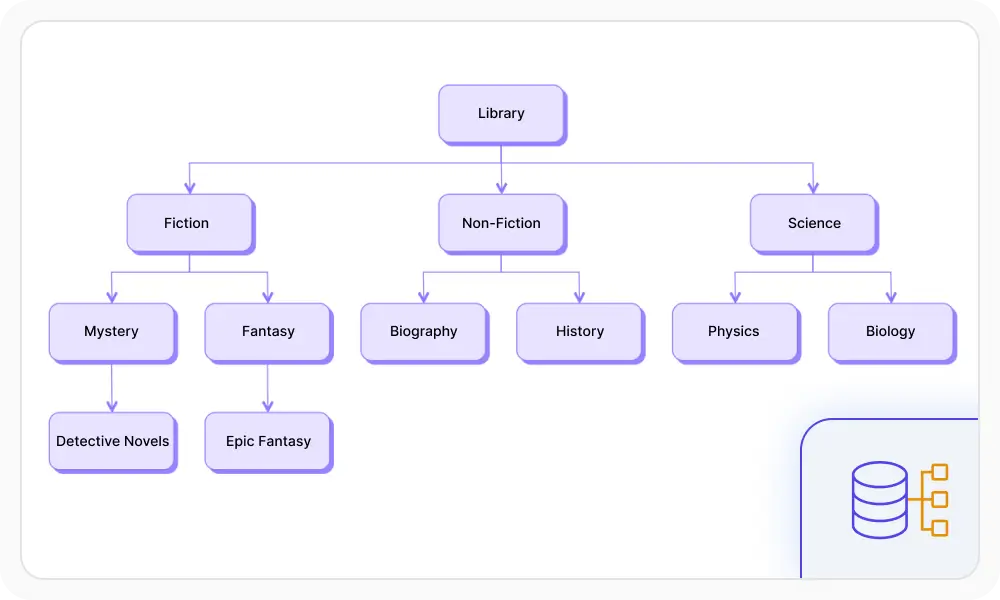
Automatically arrange nodes using predefined layout algorithms. The component supports hierarchical tree, radial tree, and symmetric layouts.
Data binding
Generate organizational charts, flowcharts, mind maps, and other hierarchical diagrams directly from relational or hierarchical data sources using built-in data binding.
Automatic diagram generation
Automatically generate diagrams from Mermaid syntax and visualize structured JSON and XML data.
Rulers
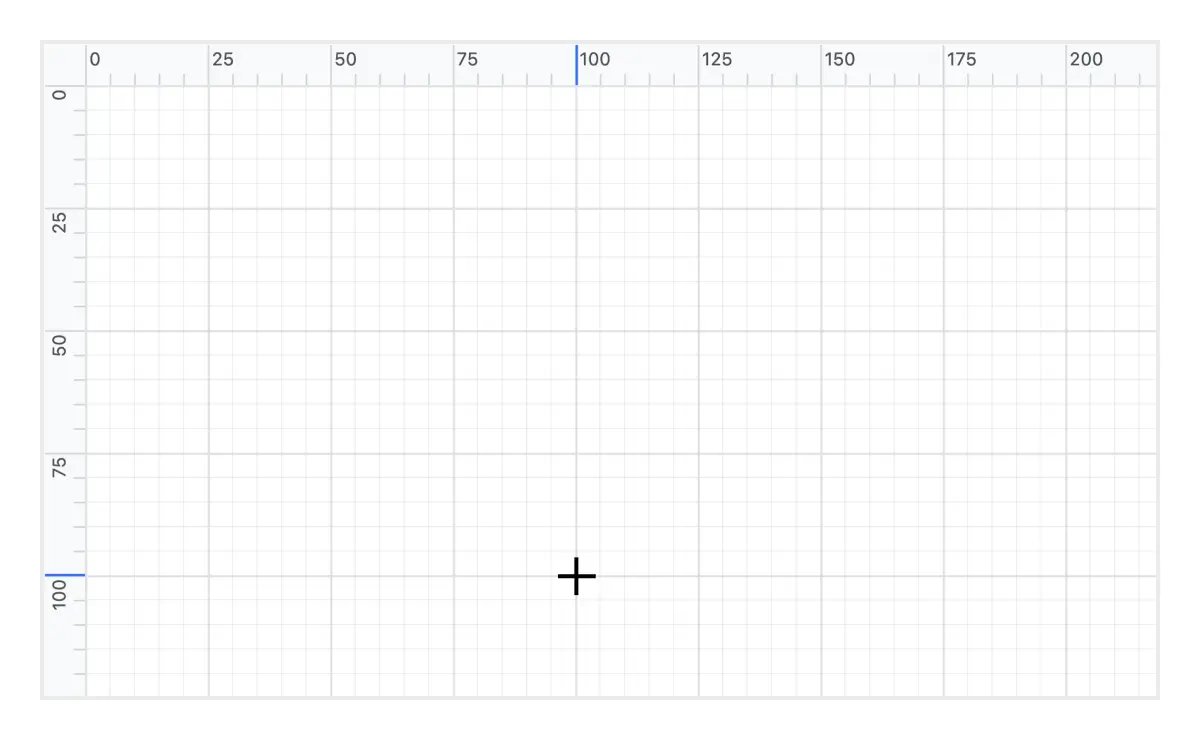
Rulers allow users to measure the distance from the origin of the page to nodes or connectors. They are especially useful for creating scale models.
Symbol palette
The React Diagram includes a symbol palette with reusable shapes, nodes, and connectors that users can drag onto the diagram surface.
Printing and exporting
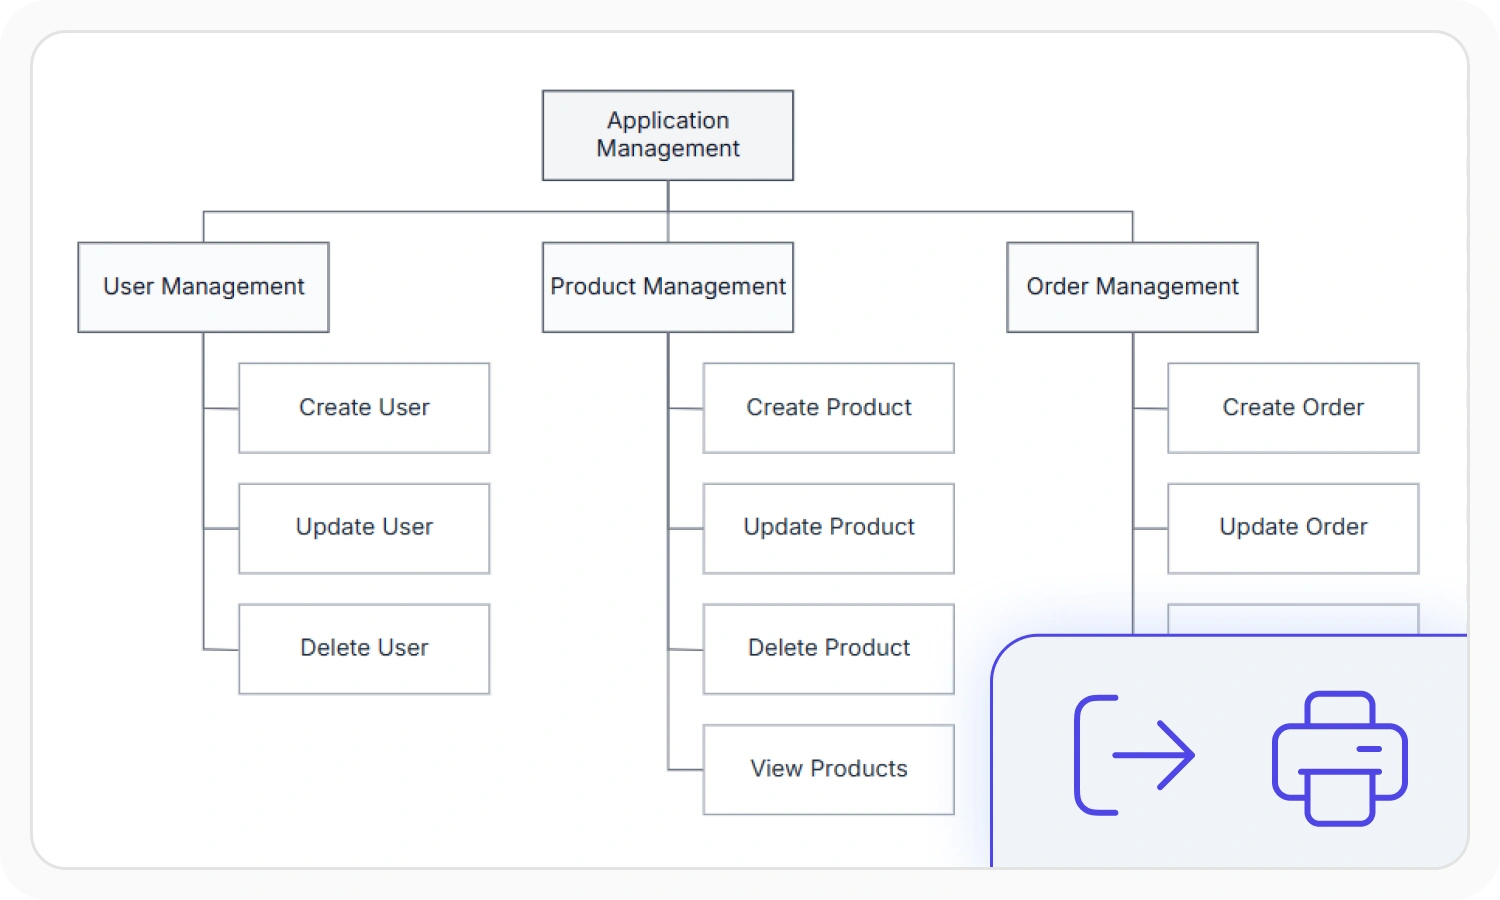
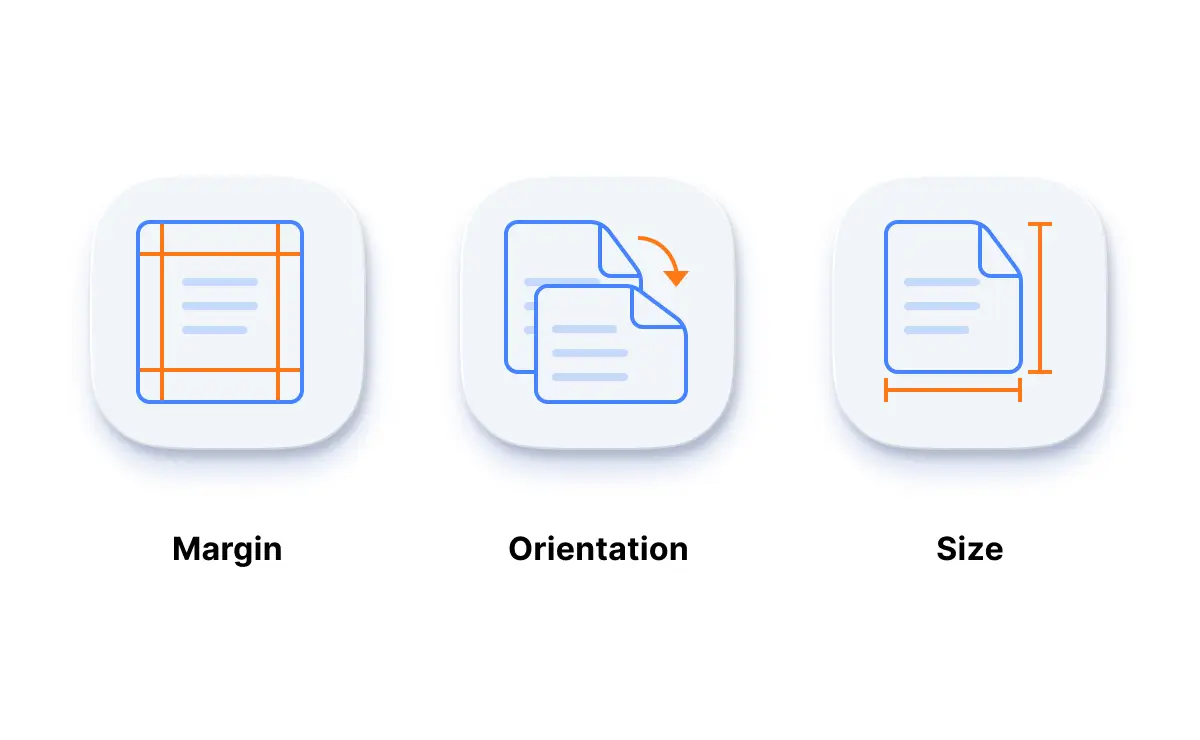
Print diagrams directly from the browser with customizable page sizes, orientations, and margins. Export diagrams in supported image and document formats, or fit the entire diagram on a single page for printing.
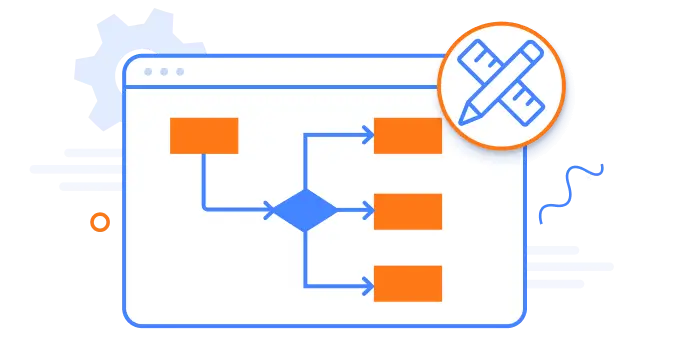
Drawing tools
Draw all built-in nodes and connect them with connectors by simply clicking and dragging in the drawing area.
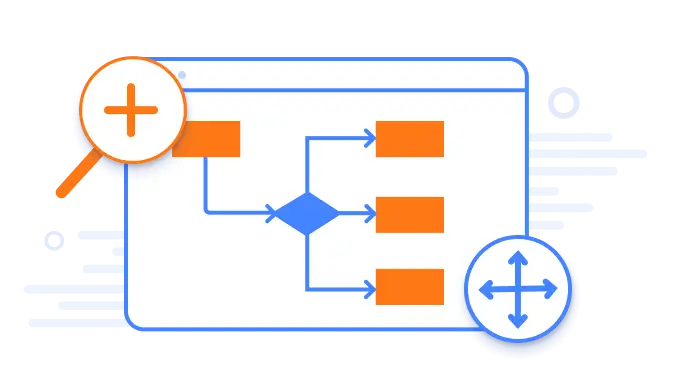
Zoom, pan, and overview
Zoom in to inspect diagram details or zoom out for a broader view. Pan across the diagram or use the overview panel’s compact preview to quickly navigate between different areas.
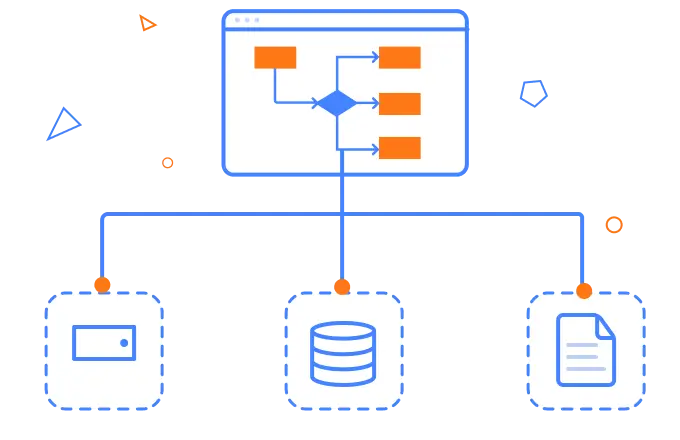
Serialization
Save the diagram state in JSON format and load it back later for further editing using the serializer.
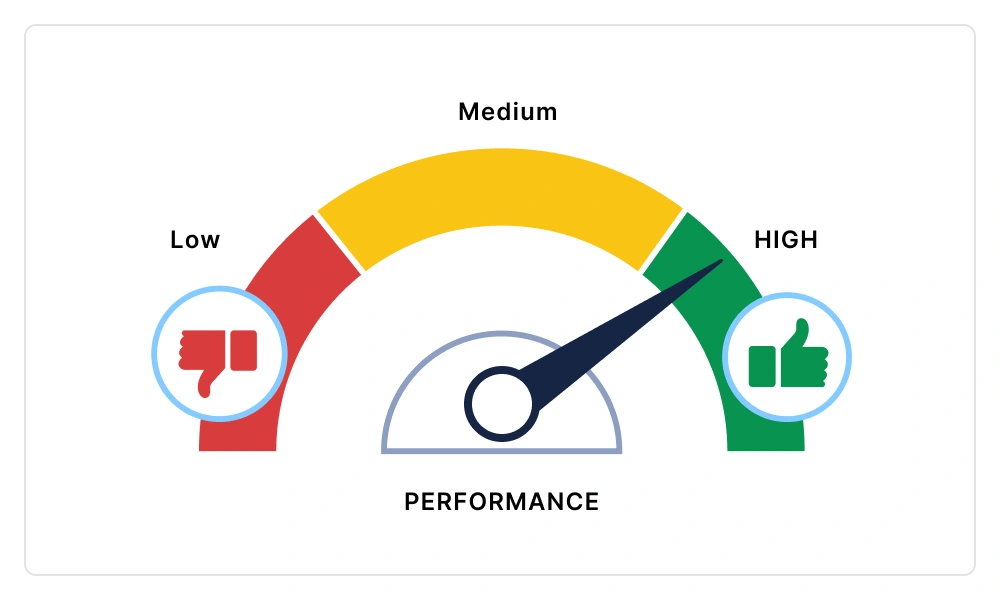
Virtualization
Quickly load large diagrams using UI-virtualization techniques, which selectively load the objects that lie within the viewport area. Smooth scrolling performance is achieved using a built-in spatial search algorithm that builds an index based on the element position.
Miscellaneous
In addition to all the features listed thus far, there are many more that enhance the diagramming experience.
Page layout
Give the drawing surface a page-like appearance using page size, orientation, and margins.
Tooltips
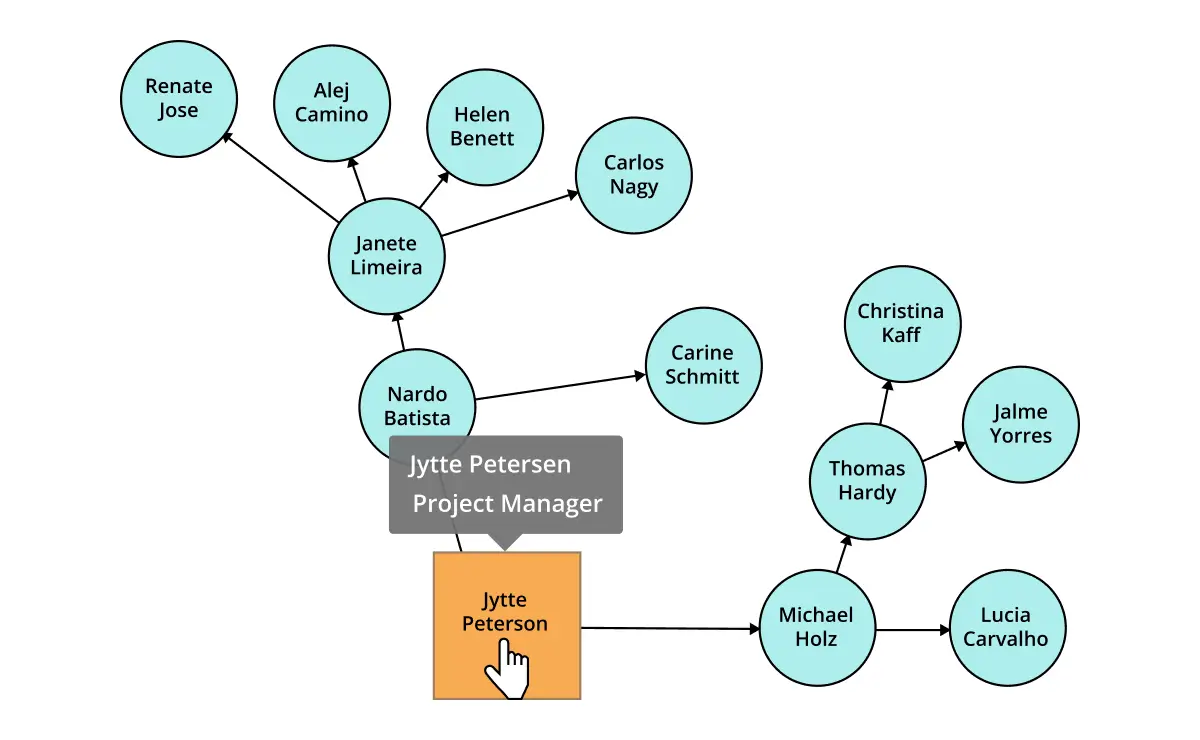
Use tooltips to provide additional information about a node.
Additional features

Keyboard navigation
The React Diagram control ensures that every cell is accessible using the keyboard. Major features like sort, select, and edit can be performed using keyboard commands alone; no mouse interaction is required. This helps create highly accessible applications with this control.

Developer-friendly APIs
Developers have full control over the UI and behavior of the Diagram through its built-in, developer-friendly APIs. It allows the customization of even complex Diagram functionalities.

Attractive, customizable themes
Create cutting-edge design with several built-in themes, such as Fluent, Tailwind CSS, Bootstrap, Material, and Fabric. Utilize the online Theme Studio tool to customize diagram themes easily.
AI-assisted development
Build feature-rich React Diagram experiences faster
Accelerate diagramming application development with Syncfusion AI tools that turn requirements into fully configured visual workflows and flowcharts with minimal manual setup.
Agentic UI Builder
Turn prompts into ready-to-use UI screens, layouts, and workflows with Syncfusion React components.
Example Prompt Create an organizational chart editor with draggable nodes and connectors.
Agent Skills
Accelerate development with Syncfusion AI Agent Skills for faster implementation and integration.
Example Prompt Generate a React flowchart with custom nodes, connectors, and automatic layout.
MCP Server
Accelerate development with AI that generates, configures, and troubleshoots component code directly in your IDE.
Example Prompt Show how to create hierarchical layouts in the Syncfusion React Diagram.
Not sure how to create your first React Diagram? Our tutorial videos and documentation can help.
I’d love to watch it now I’d love to read it nowFrequently Asked Questions
Why should you choose the Syncfusion React Diagram?
- Visualize, create, and edit interactive diagrams.
Deliver blazing-fast load times, rich UI interactions, and keyboard navigation.
Load a wide range of nodes with optimum performance.
Create flowchart diagrams with many built-in shapes and flexible data binding.
Easily arrange Diagram components with automatic layouts to create organization charts, mind maps, radial tree charts, and hierarchical tree charts.
Enjoy seamless exporting and printing capabilities.
- Build with simple configuration and APIs.
- Render in all modern browsers.
- Target all devices with its touch-friendly, responsive design.
Take advantage of expansive learning resources such as demos and documentation to get started quickly.
Where can I find the Syncfusion React Diagram demo?
You can find our React Diagram demo here, which demonstrates how to render and configure the Diagram.
Is Syncfusion a React diagram library?
Yes. If you’re looking for a React diagram library, the Syncfusion React Diagram component provides everything you need to create interactive flowcharts, organizational charts, BPMN diagrams, UML diagrams, and mind maps with powerful APIs and built-in editing capabilities.
Can I download and utilize the Syncfusion React Diagram for free?
No, this is a commercial product and requires a paid license. However, a free community license is also available for companies and individuals whose organizations have less than $1 million USD in annual gross revenue, 5 or fewer developers, and 10 or fewer total employees.
How do I get started with the Syncfusion React Diagram?
A good place to start would be our comprehensive getting started documentation.
Trusted by the world’s leading companies

Our Customers Love Us




Transform your applications today by downloading our free evaluation version
No credit card required | 770K+ downloads
Syncfusion React Diagram resources


 Figma download








