Overview
The WPF Pie Chart is a circular graphic, which is ideal for displaying proportional values in different categories. Pie charts support animation and interactive features such as tooltip and selection.

Key features

Explode on touch
Explode a slice in the WPF Pie Chart to differentiate it from other slices.

Semi pie
Configure the semi pie for compact visualization and reduce the size of the rendering area.

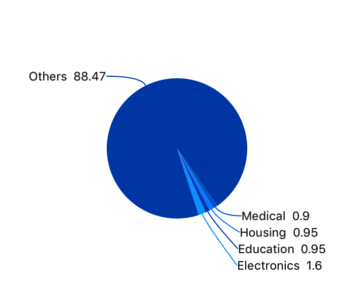
Grouping
Group smaller segments in the WPF Pie Chart to a single segment called “others”.
Data labels
Data labels display information about the data points. It provides the support for customizing the foreground, border, and background in addition to template support to customize the default appearance with the desired view. You can rotate a data label by its given angle.
Code example
Easily get started with WPF Pie Chart using a few simple lines of XAML and C# code, as demonstrated below,
<Window x:Class="ChartExample.MainWindow"
        xmlns="http://schemas.microsoft.com/winfx/2006/xaml/presentation"
        xmlns:x="http://schemas.microsoft.com/winfx/2006/xaml"
        xmlns:d="http://schemas.microsoft.com/expression/blend/2008"
        xmlns:mc="http://schemas.openxmlformats.org/markup-compatibility/2006"
        xmlns:local="clr-namespace:ChartExample"
        xmlns:chart="clr-namespace:Syncfusion.UI.Xaml.Charts;assembly=Syncfusion.SfChart.WPF"
        mc:Ignorable="d"
        Title="WPF Pie Chart" Height="450" Width="700">

    <!--Setting DataContext-->
    <Window.DataContext>
        <local:ViewModel/>
    </Window.DataContext>

    <StackPanel>
        <chart:SfChart Height="300" Width="500">
            <!--Adding Pie Series to the WPF Chart-->
            <chart:PieSeries ItemsSource="{Binding Data}" XBindingPath="Month" YBindingPath="Target">
            </chart:PieSeries>
        </chart:SfChart>
    </StackPanel>
</Window>
public class Model
{
public string Month { get; set; }
public double Target { get; set; }
public Model(string xValue, double yValue)
{
Month = xValue;
Target = yValue;
}
}
public class ViewModel
{
public ObservableCollection<Model> Data { get; set; }
public ViewModel()
{
Data = new ObservableCollection<Model>()
{
new Model("Jan", 50),
new Model("Feb", 70),
new Model("Mar", 65),
new Model("Apr", 57),
new Model("May", 48),
};
}
}Learning resources

Explore the WPF Pie Chart example from GitHub to learn how to render and configure charts.

