We use cookies to give you the best experience on our website. If you continue to browse, then you agree to our privacy policy and cookie policy.

The WPF Stock Chart or Candlestick Chart is most often used to represent high, low, open, and close values of stocks on the stock market. It visualizes financial data and shows the data at equal intervals. It is often combined with line and column charts to show the close value and volume of the data. This type of chart supports interactive trackball, tooltip, and crosshair features to track information about the data.
WPF Candlestick Chart documentation


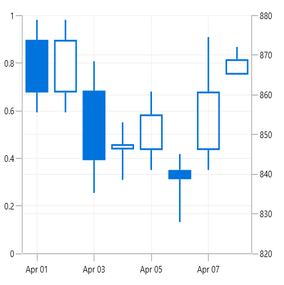
Configure the hollow or filled candlestick appearance in a chart to communicate more information about the stock data at a glance.

Use multiples series in a candlestick chart to represent two or more data sets, where each data set represents high, low, open, and close values.
The WPF Candle Chart allows you to render stock prices on different axes of the chart. Visualize the candle values in one pane and the trading volume in a different pane.
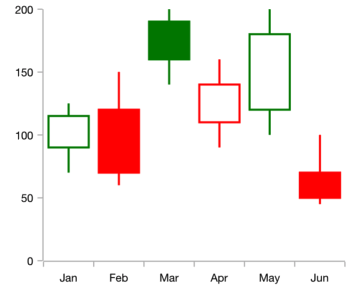
Customize the bull and bear market colors in a WPF Candle Chart.
Easily get started with the WPF Candlestick Chart using a few simple lines of C# code example as demonstrated below,
<Window x:Class="ChartExample.MainWindow"
        xmlns="http://schemas.microsoft.com/winfx/2006/xaml/presentation"
        xmlns:x="http://schemas.microsoft.com/winfx/2006/xaml"
        xmlns:d="http://schemas.microsoft.com/expression/blend/2008"
        xmlns:mc="http://schemas.openxmlformats.org/markup-compatibility/2006"
        xmlns:local="clr-namespace:ChartExample"
        xmlns:chart="clr-namespace:Syncfusion.UI.Xaml.Charts;assembly=Syncfusion.SfChart.WPF"
        mc:Ignorable="d"
        Title="WPF Candlestick Chart" Height="450" Width="700">

    <!--Setting DataContext-->
    <Window.DataContext>
        <local:ViewModel/>
    </Window.DataContext>

    <StackPanel>
        <chart:SfChart Height="300" Width="500">
            <!--Initialize the horizontal axis for the WPF Chart-->
            <chart:SfChart.PrimaryAxis>
                <chart:DateTimeAxis  LabelFormat="MMM dd"/>
            </chart:SfChart.PrimaryAxis>

            <!--Initialize the vertical axis for the WPF Chart-->
            <chart:SfChart.SecondaryAxis>
                <chart:NumericalAxis/>
            </chart:SfChart.SecondaryAxis>

            <!--Adding Candle Series to the WPF Chart-->
             <chart:CandleSeries
                Close="Close"
                ComparisonMode="Low"
                High="High"
                ItemsSource="{Binding StockPriceDetails}"
                Low="Low"
                Open="Open"
                XBindingPath="Date" />
        </chart:SfChart>
    </StackPanel>
</Window>
public class CandleChartModel
{
public DateTime Date { get; set; }
public double High { get; set; }
public double Low { get; set; }
public double Open { get; set; }
public double Close { get; set; }
}
public class ViewModel
{
public ViewModel()
{
this.StockPriceDetails = new ObservableCollection<CandleChartModel>();
DateTime date = new DateTime(2012, 4, 1);
this.StockPriceDetails.Add(new CandleChartModel() { Date = date.AddDays(0), Open = 873.8, High = 878.85, Low = 855.5, Close = 860.5 });
this.StockPriceDetails.Add(new CandleChartModel() { Date = date.AddDays(1), Open = 873.8, High = 878.85, Low = 855.5, Close = 860.5 });
this.StockPriceDetails.Add(new CandleChartModel() { Date = date.AddDays(2), Open = 861, High = 868.4, Low = 835.2, Close = 843.45 });
this.StockPriceDetails.Add(new CandleChartModel() { Date = date.AddDays(3), Open = 846.15, High = 853, Low = 838.5, Close = 847.5 });
this.StockPriceDetails.Add(new CandleChartModel() { Date = date.AddDays(4), Open = 846, High = 860.75, Low = 841, Close = 855 });
this.StockPriceDetails.Add(new CandleChartModel() { Date = date.AddDays(5), Open = 841, High = 845, Low = 827.85, Close = 838.65 });
this.StockPriceDetails.Add(new CandleChartModel() { Date = date.AddDays(6), Open = 846, High = 874.5, Low = 841, Close = 860.75 });
this.StockPriceDetails.Add(new CandleChartModel() { Date = date.AddDays(7), Open = 865, High = 872, Low = 865, Close = 868.9 });
}
public ObservableCollection<CandleChartModel> StockPriceDetails { get; set; }
}
Learn more about the available options for customizing WPF Candle Charts.
 You are using an outdated version of Internet Explorer that may not display all features of this and other websites. Upgrade to Internet Explorer 8 or newer for a better experience.

