Overview
The WPF Chart component supports 10 different types of built-in financial technical indicators such as RSI, momentum, Bollinger bands, accumulation distribution, EMA, SMA, stochastic, ATR, MACD, and TMA indicators.
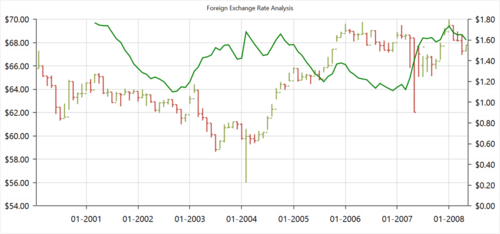
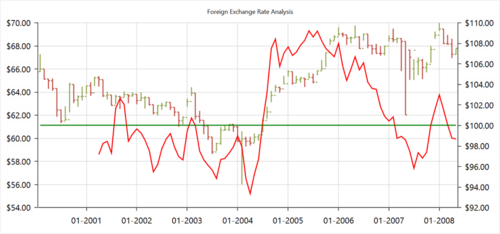
Average true indicator
The average true indicator measures stock volatility by comparing the current value with the previous value.
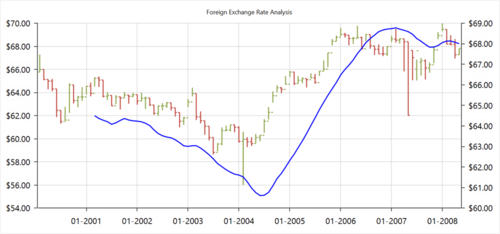
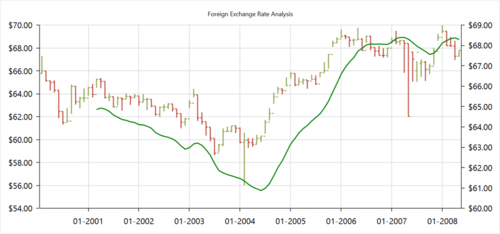
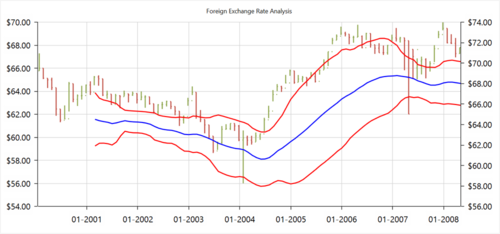
Simple moving average indicator
The simple moving average indicator is a simple, arithmetic moving average that is calculated by adding the closing price for a number of time periods and dividing the total value by the number of time periods.
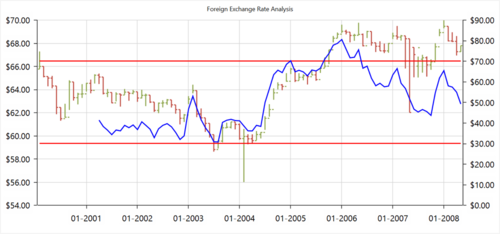
Relative strength index indicator
The relative strength index indicator shows how strongly a stock is moving in its current direction.
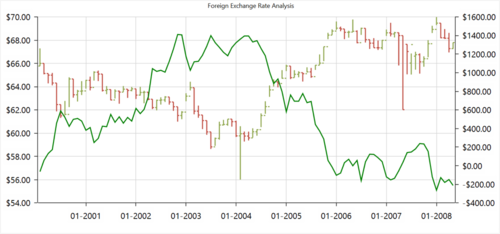
Accumulation distribution indicator
The accumulation distribution indicator uses price and volume to determine the trend of a stock and whether a stock is being accumulated or distributed..
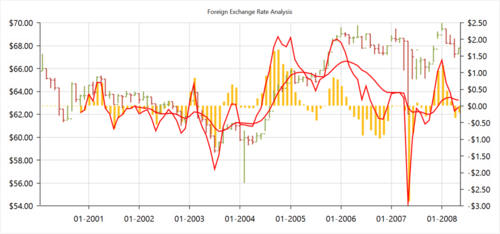
Momentum indicator
The momentum indicator shows the speed or rate of stock price fluctuation.
Stochastic indicator
The stochastic indicator measures the momentum of price movements and shows the status of a stock compared to a previous state.
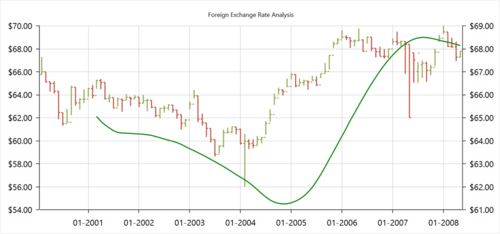
Exponential moving average indicator
The exponential moving average indicator is a type of moving average indicator that tracks the price of an investment emphasizes the most recent price data.
Triangular moving average indicator
The triangular moving average indicator is a type of moving average indicator that shows the mean price over a specified number of data points.
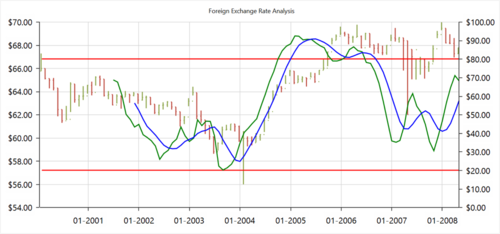
Bollinger band indicator
A chart overlay that shows the upper and lower limits of normal price movements based on the standard deviation of prices.
MACD Indicator
The moving average convergence divergence (MACD) indicator is based on the difference between two exponential moving average indicators. It is predominately used to trade trends.
Our Customers Love Us


See Real Success Stories
Developers around the world trust Syncfusion’s Essential Studio to simplify complex projects and speed up delivery. With a vast library of UI controls, powerful SDKs, and reliable support, Essential Studio helps teams build enterprise-ready applications with confidence.
Read Our Customer StoriesIndustry
Software development
75% Cost reduction
50% Faster development
Industry
Utilities (oil and gas)
450+ hours saved
Streamlined processes and hours of development effort saved.
Advanced, flexible features
Empowered users through robust and versatile functionality.
Industry
Software and technology
1000+ of hours saved
Accelerated development with enterprise-ready UI components.
Efficient file management
Streamlined workflows with document libraries without building them from scratch.
Industry
Software and technology
2 Years of delay avoided
Two years of delays prevented with proactive planning.
On-time delivery
Projects delivered on schedule using trusted controls.
Industry
IT services and IT consulting
Improved performance
Large datasets handled with easy customization and quick debugging.
Highly customizable
Plug-and-play controls with quick template integration.
Industry
Professional services
Instant access
Quick availability of features and resources.
Reduced dependencies
Fewer dependencies for faster development.