Overview
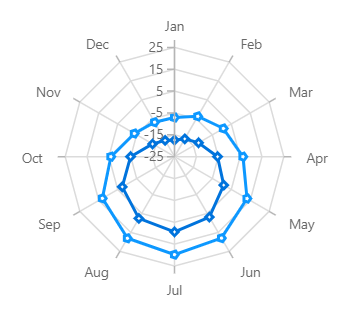
The WPF Radar Chart visualizes data in terms of values and angles. It provides options for visual comparison between several quantitative or qualitative aspects of a situation. It supports interactive features such as selection and tooltip.
Key features
Draw type
Two types of draw types, area and line, are supported by the WPF Radar Chart.

Angle customization
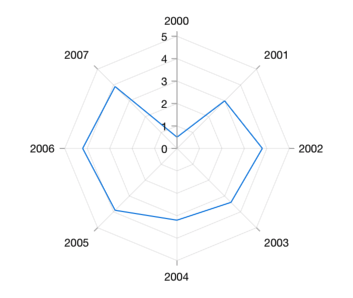
Customize the start angle of a radar chart to visualize data in a different perspective.
UI Styling
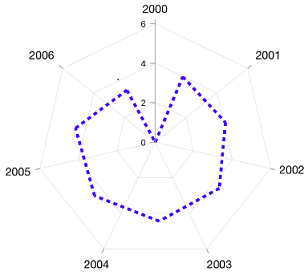
Customize the color and dashes of the WPF Radar Chart using built-in APIs to make it visually unique.

Display markers
The WPF Radar Chart data points are visualized as marks with the built-in symbols such as cross, square, plus, inverted triangles, hexagon, ellipses, vertical lines, horizontal lines, diamonds, triangles, and pentagons.
Code example
Easily get started with WPF Radar Chart using a few simple lines of XAML and C# code, as demonstrated below,
<Window x:Class="ChartExample.MainWindow"
        xmlns="http://schemas.microsoft.com/winfx/2006/xaml/presentation"
        xmlns:x="http://schemas.microsoft.com/winfx/2006/xaml"
        xmlns:d="http://schemas.microsoft.com/expression/blend/2008"
        xmlns:mc="http://schemas.openxmlformats.org/markup-compatibility/2006"
        xmlns:local="clr-namespace:ChartExample"
        xmlns:chart="clr-namespace:Syncfusion.UI.Xaml.Charts;assembly=Syncfusion.SfChart.WPF"
        mc:Ignorable="d"
        Title="WPF Radar Chart" Height="450" Width="700">

    <!--Setting DataContext-->
    <Window.DataContext>
        <local:ViewModel/>
    </Window.DataContext>

    <StackPanel>
        <chart:SfChart Height="300" Width="500">
            <!--Initialize the horizontal axis for the WPF Chart-->
            <chart:SfChart.PrimaryAxis>
                <chart:CategoryAxis/>
            </chart:SfChart.PrimaryAxis>

            <!--Initialize the vertical axis for the WPF Chart-->
            <chart:SfChart.SecondaryAxis>
                <chart:NumericalAxis
                    EdgeLabelsDrawingMode="Fit"
                    SmallTickLineSize="6"
                    SmallTicksPerInterval="1"
                    TickLineSize="10" />
            </chart:SfChart.SecondaryAxis>

            <!--Adding Radar Series to the WPF Chart-->
            <chart:RadarSeries
                ItemsSource="{Binding PlantDetails}"
                XBindingPath="Direction"
                YBindingPath="Flower"
               >
           </chart:RadarSeries>
        </chart:SfChart>
    </StackPanel>
</Window>
public class PolarChartModel
{
public string Direction { get; set; }
public double Weed { get; set; }
public double Flower { get; set; }
public double Tree { get; set; }
}
public class ViewModel
{
public ObservableCollection<PolarChartModel> PlantDetails { get; set; }
public ViewModel()
{
this.PlantDetails = new ObservableCollection<PolarChartModel>();
this.PlantDetails.Add(new PolarChartModel() { Direction = "North", Weed = 63, Flower = 42, Tree = 80 });
this.PlantDetails.Add(new PolarChartModel() { Direction = "NorthEast", Weed = 70, Flower = 40, Tree = 85 });
this.PlantDetails.Add(new PolarChartModel() { Direction = "East", Weed = 45, Flower = 25, Tree = 78 });
this.PlantDetails.Add(new PolarChartModel() { Direction = "SouthEast", Weed = 70, Flower = 40, Tree = 90 });
this.PlantDetails.Add(new PolarChartModel() { Direction = "South", Weed = 47, Flower = 20, Tree = 78 });
this.PlantDetails.Add(new PolarChartModel() { Direction = "SouthWest", Weed = 65, Flower = 45, Tree = 83 });
this.PlantDetails.Add(new PolarChartModel() { Direction = "West", Weed = 58, Flower = 40, Tree = 79 });
this.PlantDetails.Add(new PolarChartModel() { Direction = "NorthWest", Weed = 73, Flower = 28, Tree = 88 });
}
}Learning resources

Explore the WPF Radar Chart example from GitHub to learn how to render and configure charts.

