Overview
The WPF Funnel Chart is like a pyramid with two parts. The higher part is called the head, and the lower part is called the neck. The funnel chart is often used to represent stages in a sales process and to show the amount of potential revenue for each stage. It makes proportional comparisons between values that are showcased as progressively decreasing. The segments in the WPF Funnel Chart can be exploded and differentiated using different colors. It supports zooming, scrolling, tooltip, trackball, and selection.
WPF Funnel Chart documentation

Key features
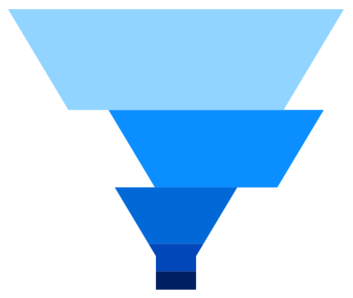
Explode on touch
Explode segments in a funnel chart to differentiate it from other segments.
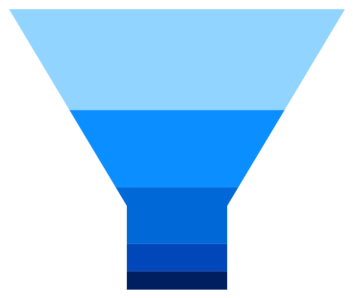
Custom neck height
Customize the height of the neck in a funnel chart to improve readability and appearance.
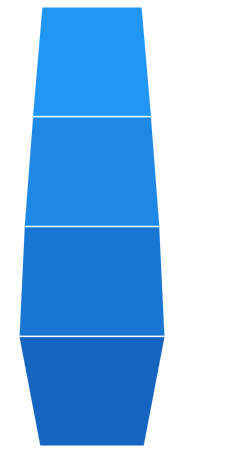
Funnel mode
Customize the height and width of entire the WPF funnel segment.

Funnel gap
The WPF Funnel Chart allows customization of the space between the segments.
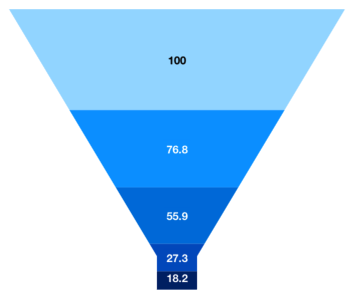
Data labels
Data labels display information about the data points. Labels’ foreground, border, and background can be customized. The template support to customize the default appearance with the desired view. You can rotate a data label by its given angle.
Code example
Easily get started with the WPF Funnel Chart using a few simple lines of C# code example as demonstrated below,
<Window x:Class="ChartExample.MainWindow"
        xmlns="http://schemas.microsoft.com/winfx/2006/xaml/presentation"
        xmlns:x="http://schemas.microsoft.com/winfx/2006/xaml"
        xmlns:d="http://schemas.microsoft.com/expression/blend/2008"
        xmlns:mc="http://schemas.openxmlformats.org/markup-compatibility/2006"
        xmlns:local="clr-namespace:ChartExample"
        xmlns:chart="clr-namespace:Syncfusion.UI.Xaml.Charts;assembly=Syncfusion.SfChart.WPF"
        mc:Ignorable="d"
        Title="WPF Funnel Chart" Height="450" Width="700">

    <!--Setting DataContext-->
    <Window.DataContext>
        <local:ViewModel/>
    </Window.DataContext>

    <StackPanel>
        <chart:SfChart Height="300" Width="500">
            <!--Initialize the horizontal axis for the WPF Chart-->
            <chart:SfChart.PrimaryAxis>
                <chart:CategoryAxis />
            </chart:SfChart.PrimaryAxis>

            <!--Initialize the vertical axis for the WPF Chart-->
            <chart:SfChart.SecondaryAxis>
                <chart:NumericalAxis />
            </chart:SfChart.SecondaryAxis>

            <!--Adding Funnel Series to the WPF Chart-->
            <chart:FunnelSeries
                    ItemsSource="{Binding Data}"
                    XBindingPath="Month"
                    YBindingPath="Target">
            </chart:FunnelSeries>
        </chart:SfChart>
    </StackPanel>
</Window>
public class Model
{
public string Month { get; set; }
public double Target { get; set; }
public Model(string xValue, double yValue)
{
Month = xValue;
Target = yValue;
}
}
public class ViewModel
{
public ObservableCollection<Model> Data { get; set; }
public ViewModel()
{
Data = new ObservableCollection<Model>()
{
new Model("Jan", 50),
new Model("Feb", 70),
new Model("Mar", 65),
new Model("Apr", 57),
new Model("May", 48),
};
}
}

