Overview
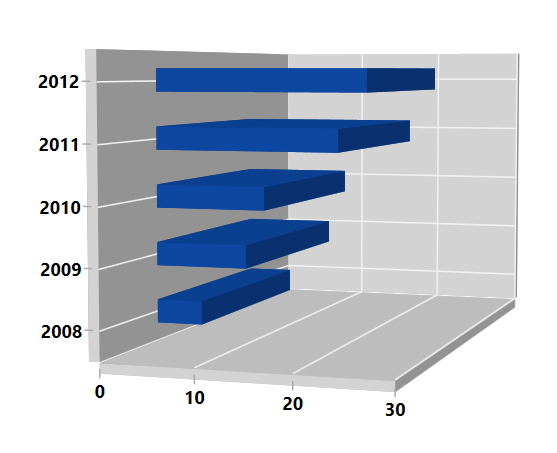
The WPF 3D Bar Chart is ideal for showing the variations in the value of an item over time. It has been arranged vertically and data values are plotted horizontally to show the variations. It supports rotation and selection.
WPF 3D Bar Chart documentation

Key features

Vertical chart
The WPF 3D Bar Chart can be transposed vertically to view the data in a different perspective.

UI styling
Customize the WPF 3D Bar Chart UI with gradient colors using built-in APIs to make it visually unique.

Wall customization
Customize the wall and depth of an axis using built-in APIs to make it visually unique.
Spacing and width
The WPF 3D Bar Chart provides options to customize the spacing between bars and their widths.

Display markers
The WPF 3D Bar Chart data points are visualized as marks with built-in symbols such as cross, square, plus, inverted triangles, hexagon, ellipses, vertical lines, horizontal lines, diamonds, triangles, and pentagons.

Data labels
Data labels display information about data points. They provide support for customizing the foreground, border, and background, along with template support to customize their default appearance with your desired view. You can rotate a data label by a specified angle.
Code example
Easily get started with the WPF 3D Bar Chart using a few simple lines of C# code example as demonstrated below,
<Window x:Class="ChartExample.MainWindow"
        xmlns="http://schemas.microsoft.com/winfx/2006/xaml/presentation"
        xmlns:x="http://schemas.microsoft.com/winfx/2006/xaml"
        xmlns:d="http://schemas.microsoft.com/expression/blend/2008"
        xmlns:mc="http://schemas.openxmlformats.org/markup-compatibility/2006"
        xmlns:local="clr-namespace:ChartExample"
        xmlns:chart="clr-namespace:Syncfusion.UI.Xaml.Charts;assembly=Syncfusion.SfChart.WPF"
        mc:Ignorable="d"
        Title="WPF 3D Bar Chart" Height="450" Width="700">

  <!--Setting DataContext-->
    <Window.DataContext>
        <local:Chart3DViewModel/>
    </Window.DataContext>

    <StackPanel HorizontalAlignment="Center"  VerticalAlignment="Center">

        <chart:SfChart3D
            Margin="50"
            Height="400" Width="400" Depth="500"
            VerticalAlignment="Bottom"
            EnableRotation="True">

            <!--  Initialize the horizontal axis for the WPF 3D Chart  -->
            <chart:SfChart3D.PrimaryAxis>
                <chart:CategoryAxis3D />
            </chart:SfChart3D.PrimaryAxis>

           <!--  Initialize the vertical axis for the WPF 3D Chart  -->
            <chart:SfChart3D.SecondaryAxis>
                <chart:NumericalAxis3D />
            </chart:SfChart3D.SecondaryAxis>

            <!--  Adding 3D Bar Chart to the WPF 3D Chart   -->
            <chart:BarSeries3D
                ItemsSource="{Binding CategoricalDatas}"
                XBindingPath="Year"
                YBindingPath="Plastic">
            </chart:BarSeries3D>
        </chart:SfChart3D>
    </StackPanel>
</Window>
public class BarChart3DModel
{
public string Year { get; set; }
public double Plastic { get; set; }
public double Metal { get; set; }
public BarChart3DModel(double metal, double plastic, string year)
{
Plastic = plastic;
Year = year;
Metal = metal;
}
}
public class Chart3DViewModel
{
public Chart3DViewModel()
{
CategoricalDatas = new ObservableCollection<BarChart3DModel>();
CategoricalDatas.Add(new BarChart3DModel(7, 5, "2008"));
CategoricalDatas.Add(new BarChart3DModel(13, 10, "2009"));
CategoricalDatas.Add(new BarChart3DModel(15, 12, "2010"));
CategoricalDatas.Add(new BarChart3DModel(21, 20, "2011"));
CategoricalDatas.Add(new BarChart3DModel(25, 23, "2012"));
}
public ObservableCollection<BarChart3DModel> CategoricalDatas
{
get;
set;
}
}

