We use cookies to give you the best experience on our website. If you continue to browse, then you agree to our privacy policy and cookie policy.

The WPF 3D Area Charts are popular for showing volume changes over a period of time. This chart looks like the 3D line chart that contains space between the line and the X-axis, filled with color. The only difference between 3D and 2D area chart is its appearance. The 3D area series has a visual third-dimension axis which holds no additional information. It supports rotation and selection.
WPF 3D Area Chart documentation


Customize the WPF 3D Area Chart UI with a gradient look using built-in APIs to make it visually unique.

The WPF 3D Area Chart data points are visualized as marks with built-in symbols such as cross, square, plus, inverted triangles, hexagon, ellipses, vertical lines, horizontal lines, diamonds, triangles, and pentagons.
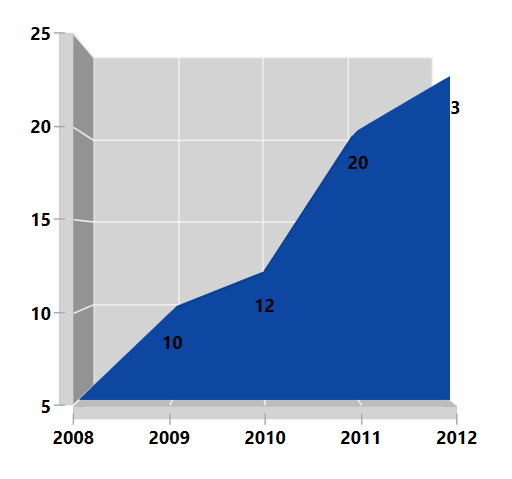
Labels display information about data points. They provide support for customizing the foreground, border, and background, along with template support to customize their default appearance with your desired view. You can rotate a data label by a specified angle.
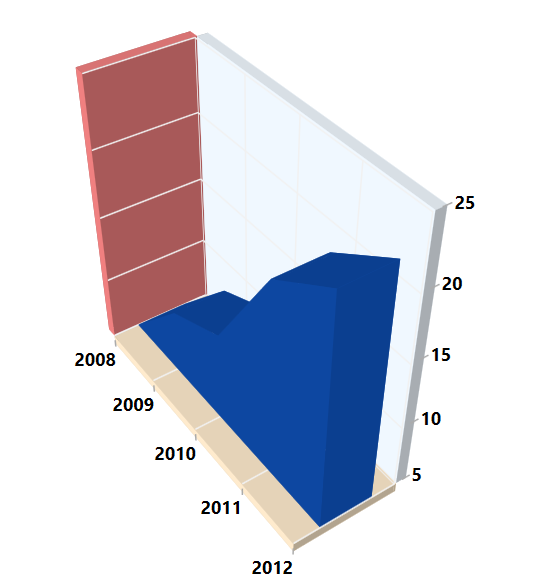
You can customize the wall and depth of an axis using built-in APIs to make it visually unique.
Easily get started with the WPF 3D Area Chart using a few simple lines of C# code example as demonstrated below,
<Window x:Class="ChartExample.MainWindow"
        xmlns="http://schemas.microsoft.com/winfx/2006/xaml/presentation"
        xmlns:x="http://schemas.microsoft.com/winfx/2006/xaml"
        xmlns:d="http://schemas.microsoft.com/expression/blend/2008"
        xmlns:mc="http://schemas.openxmlformats.org/markup-compatibility/2006"
        xmlns:local="clr-namespace:ChartExample"
        xmlns:chart="clr-namespace:Syncfusion.UI.Xaml.Charts;assembly=Syncfusion.SfChart.WPF"
        mc:Ignorable="d"
        Title="WPF 3D Area Chart" Height="450" Width="700">

  <!--Setting DataContext-->
    <Window.DataContext>
        <local:Chart3DViewModel/>
    </Window.DataContext>

    <StackPanel HorizontalAlignment="Center"   VerticalAlignment="Center">

        <chart:SfChart3D
            Margin="50"
            Height="400" Width="400" Depth="500"
            VerticalAlignment="Bottom"
            EnableRotation="True">

            <!--  Initialize the horizontal axis for the WPF 3D Chart  -->
            <chart:SfChart3D.PrimaryAxis>
                <chart:CategoryAxis3D />
            </chart:SfChart3D.PrimaryAxis>

             <!--  Initialize the vertical axis for the WPF 3D Chart  -->
            <chart:SfChart3D.SecondaryAxis>
                <chart:NumericalAxis3D />
            </chart:SfChart3D.SecondaryAxis>

            <!--  Adding 3D Area Series to the WPF 3D Chart  -->
            <chart:AreaSeries3D
                ItemsSource="{Binding CategoricalDatas}"
                XBindingPath="Year"
                YBindingPath="Plastic">
            </chart:AreaSeries3D>
        </chart:SfChart3D>
    </StackPanel>
</Window>
public class BarChart3DModel
{
public string Year { get; set; }
public double Plastic { get; set; }
public double Metal { get; set; }
public BarChart3DModel(double metal, double plastic, string year)
{
Plastic = plastic;
Year = year;
Metal = metal;
}
}
public class Chart3DViewModel
{
public Chart3DViewModel()
{
CategoricalDatas = new ObservableCollection<BarChart3DModel>();
CategoricalDatas.Add(new BarChart3DModel(7, 5, "2008"));
CategoricalDatas.Add(new BarChart3DModel(13, 10, "2009"));
CategoricalDatas.Add(new BarChart3DModel(15, 12, "2010"));
CategoricalDatas.Add(new BarChart3DModel(21, 20, "2011"));
CategoricalDatas.Add(new BarChart3DModel(25, 23, "2012"));
}
public ObservableCollection<BarChart3DModel> CategoricalDatas
{
get;
set;
}
}
Learn more about the available options to customize WPF 3D Area Charts.
 You are using an outdated version of Internet Explorer that may not display all features of this and other websites. Upgrade to Internet Explorer 8 or newer for a better experience.

