






Transform your applications today by downloading our free evaluation version
Overview
The JavaScript Maps control is ideal for rendering Maps from GeoJSON data or other map providers like OpenStreetMap, Google Maps, and Bing Maps. Its rich feature set includes markers, labels, bubbles, navigation lines, legends, tooltips, zooming, panning, drill down, and more.
Why choose the Syncfusion JavaScript Maps library?
Easy to customize
To visualize a geometric shape in SVG format in Maps, you bind GeoJSON data to it. GeoJSON data is light and simple to read. You can render a world map or a U.S. map and alter it with the JavaScript Maps control’s built-in options to achieve the required layout.
Geospatial imaging services
Work with services like Google Maps, Bing Maps, and OpenStreetMap to view satellite, aerial, and street maps by locating map data quickly without the use of any external shape inputs.
AI-Assisted Development
Build interactive geospatial experiences faster with the Agentic UI Builder and Syncfusion Agent Skills. Generate map visualizations, markers, layers, and location-based insights with minimal manual effort.
Multiple geometric layers
A map with several geometric layers in a single view can be generated with sublayers. You can render the geographic elements of a country, such as rivers and valleys, as a sublayer. Each layer can be drilled.
Adapts to any resolution
Maps has a highly responsive layout and an optimized design for desktops, tablets, and phones. It works well on all mobile phones that use iOS, Android, or Windows OS.
Custom projections
The JavaScript Maps component supports Mercator, rectangular, Miller, Eckert 3, Eckert 5, Eckert 6, and Winkel 3 projections.
Zooming and panning
Zooming and panning in JavaScript Maps are fast. Zoom the map by scrolling the mouse wheel, clicking the shapes, or using the zooming toolbar. Pan the map to navigate among regions easily.
Globalization and localization
An internationalization library is used to globalize number, date, and time values in Maps. All the strings used in the Maps user interface can be localized by users as needed. Localizing UI strings involves using the localization (l10n) library.
JavaScript Maps code example
Easily get started with the JavaScript Maps library using a few simple lines of HTML and TS code, as demonstrated in the following. Also explore our JavaScript Maps library example, which shows you how to render maps.
<!DOCTYPE html>
<html lang="en">
<head>
    <title>Essential JS 2</title>
    <script src="node_modules/systemjs/dist/system.src.js" type="text/javascript"></script>
    <script src="system.config.js" type="text/javascript"></script>
</head>
<body>
    <div id="container"></div>
</body>
</html>
import { world_map } from './world_map';
import { Maps } from '@syncfusion/ej2-maps';
let map: Maps = new Maps({
layers: [
{
shapeData: world_map,
dataSource: [
{ Country: 'United States', Membership: 'Permanent', Color: '#feb24c' },
{ Country: 'United Kingdom', Membership: 'Permanent', Color: '#feb24c' },
{ Country: 'Russia', Membership: 'Permanent', Color: '#feb24c' },
{ Country: 'France', Membership: 'Permanent', Color: '#feb24c' },
{ Country: 'China', Membership: 'Permanent', Color: '#feb24c' },
{ Country: 'Albania', Membership: 'Non-permanent', Color: '#f03b20' },
{ Country: 'Brazil', Membership: 'Non-permanent', Color: '#f03b20' },
{ Country: 'Gabon', Membership: 'Non-permanent', Color: '#f03b20' },
{ Country: 'Ghana', Membership: 'Non-permanent', Color: '#f03b20' },
{ Country: 'India', Membership: 'Non-permanent', Color: '#f03b20' },
{ Country: 'Ireland', Membership: 'Non-permanent', Color: '#f03b20' },
{ Country: 'Kenya', Membership: 'Non-permanent', Color: '#f03b20' },
{ Country: 'Mexico', Membership: 'Non-permanent', Color: '#f03b20' },
{ Country: 'Norway', Membership: 'Non-permanent', Color: '#f03b20' },
{ Country: 'United Arab Emirates', Membership: 'Non-permanent', Color: '#f03b20' }],
shapePropertyPath: 'name',
shapeDataPath: 'Country',
shapeSettings: {
fill: '#E5E5E5',
colorValuePath: 'Color',
},
},
],
});
map.appendTo('#container');AI-assisted development
Build feature-rich JavaScript Maps experiences faster
Accelerate geospatial application development with Syncfusion AI tools that turn requirements into fully configured map visualizations with minimal manual setup.
Agent Skills
Accelerate development with Syncfusion AI Agent Skills for faster implementation and integration.
Example Prompt Generate a JavaScript map with markers, legends, layers, and interactive tooltips.
MCP Server
Accelerate development with AI that generates, configures, and troubleshoots component code directly in your IDE.
Example Prompt Show how to render GeoJSON data in Syncfusion JavaScript Maps.
GeoJSON layer
Bind GeoJSON data to the maps to render any geometric shape in SVG (scalable vector graphics) format to visualize data. For example, render a world map or U.S. map and customize it to the desired look using built-in options. Add any number of layers to the maps.

Geometric types
GeoJSON data contains geometric objects with properties such as geometry types and coordinates. The geometric types are the values present in the geometric objects of the GeoJSON data that specify the type of shape to be rendered, along with the coordinates that help to draw the shape’s boundary line. Polygon, MultiPolygon, LineString, MultiLineString, Point, MultiPoint, and GeometryCollection are the supported geometric types.
Geo-imagery visuals
Built-in support for external geospatial imagery services, such as Bing Maps and OpenStreetMap, is used to visualize satellite, aerial, and street maps, or other kinds of imagery tiles without any external shape inputs. Users can render maps from various map providers like Google Maps Tile API, TomTom, Mapbox, and Esri’s ArcGIS. By using these external services, map data can be located easily.

Multiple layers
Using sublayers, a map can be created with multiple geometric layers in a single view. For example, render additional geographic features of a country such as rivers and valleys as sublayers. You can also drill each layer.
Markers
Denote a place with symbols or make a note at a desired latitude and longitude on a map using markers. For example, indicate a particular place on the U.S. map using a balloon marker shape. You can place any HTML element as a marker and add multiple markers to the map.


Marker clustering
Display multiple markers in the same location by clustering them. For example, use markers to indicate the top 50 cities in the world. If one marker overlaps another, they will be clustered, and the total number of markers will be displayed over the cluster.
Marker drag and drop
You can drag and drop markers to reposition them in a map. After dragging and dropping markers, the marker data source and elements such as marker shape, color, legend, and tooltip content can be changed using supported events.

Polygons
Polygons can be displayed over a shape layer or an online map to highlight a specific region.
Data labels
Data labels on a map provide identification for shapes by displaying their names. Trim or hide the labels at intersections with other labels and when they exceed shape bounds.


Bubbles
Use bubbles to represent additional information about shapes in a map such as population density or land area. Bubbles are rendered with various magnitudes and colors based on their underlying data values.
Navigation lines
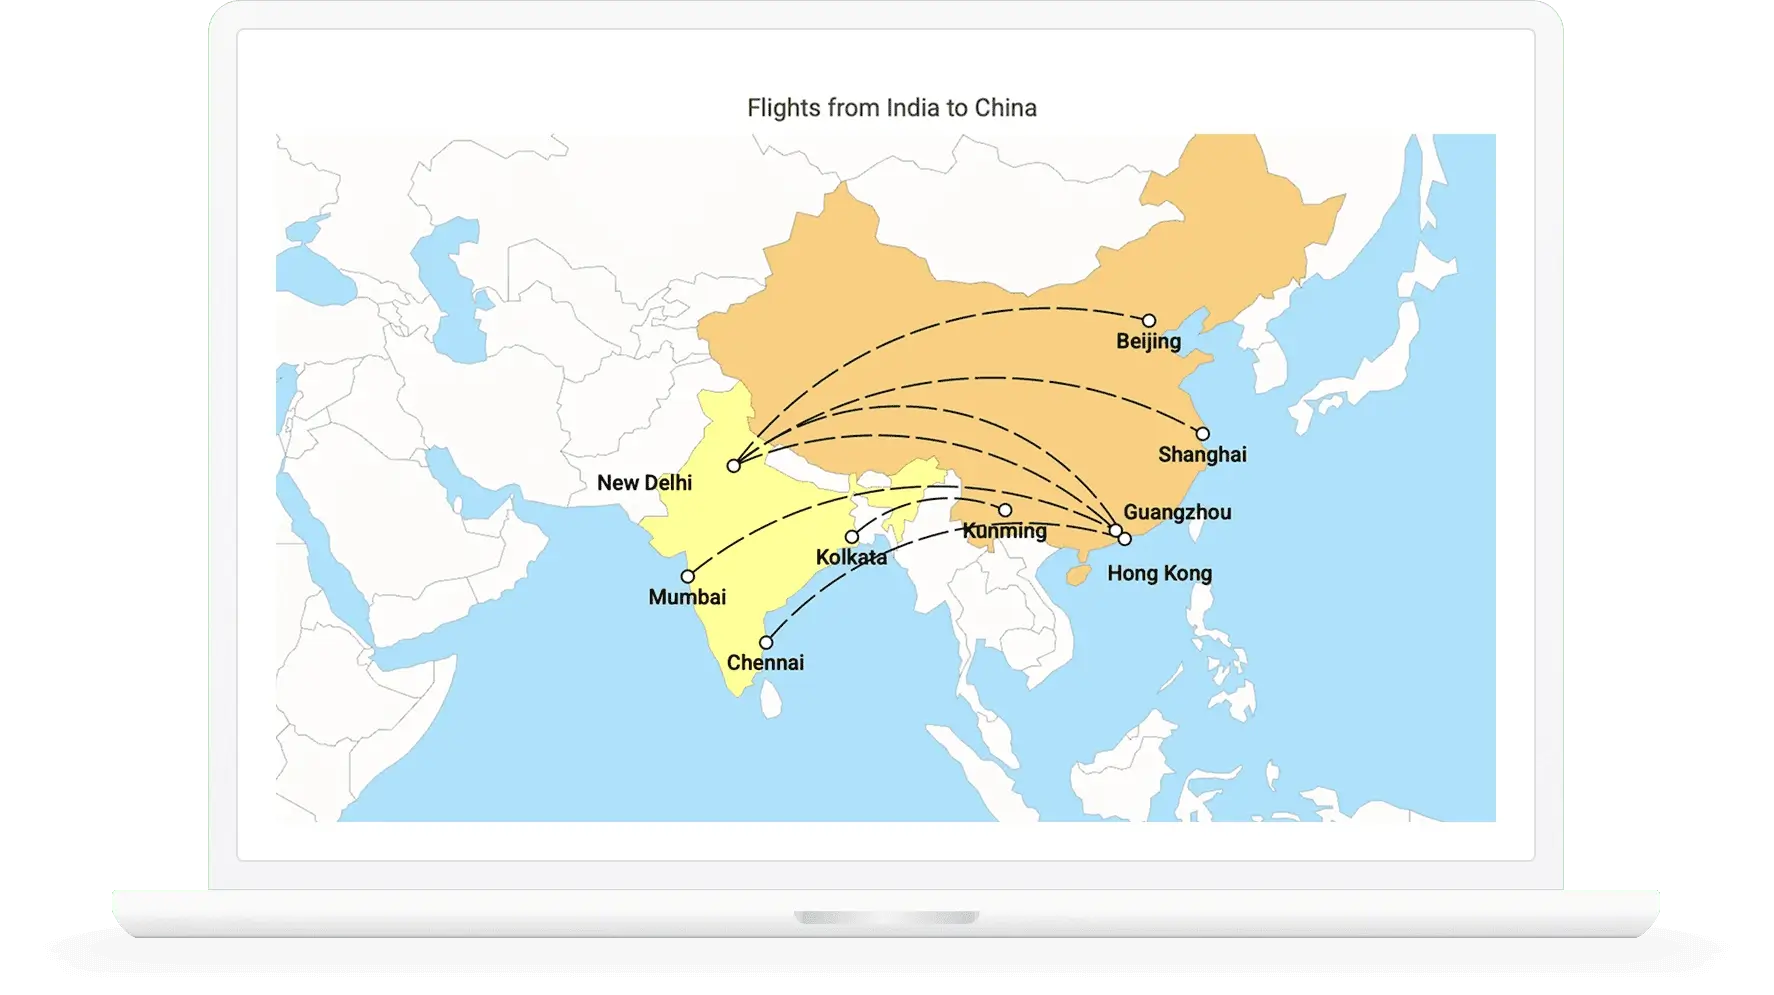
Denote flight routes or ship routes between two places on a geographic map with connector lines. The lines can be straight or curved.

Color mapping
Categorize the shapes on a map by customizing their colors based on the underlying values. The JavaScript Maps control supports three types of color mapping: range color mapping, equal color mapping, and desaturation color mapping.

Range color mapping
Apply colors to the shapes by comparing their values with a desired numeric range. For example, apply colors to the states in the U.S. based on population density.

Equal color mapping
Differentiate a shape’s fill based on its underlying values and colors using equal color mapping. For example, apply colors to states in a U.S. map based on a winning political candidate.

Desaturation color mapping
Change the opacity of the shapes by comparing their values with a desired numeric range. Minimum and maximum opacity of the shapes can be customized.

Desaturation with multiple colors
Apply multiple colors to a shape from a gradient by comparing values with a desired numeric range. Any number of colors can be specified for creating the gradient.
Legends
Legends provide valuable information for interpreting a map by explaining colors, shapes, and other identifiers based on the data visualized. The JavaScript Maps library supports two types of legends: default and interactive.

Default
A map with a legend contains swatches of symbols with descriptions to denote the categories of shapes.

Interactive
Use a map with an interactive legend to find the range of a shape’s underlying value on mouse hover.
Zooming and panning
Zoom JavaScript Maps for close-up analysis by pinching the map, scrolling the mouse wheel, clicking the shapes, or using the zooming toolbar. Pan the map for easy navigation across regions. Users can also change the zoom level of the initial rendering.

Tooltip
The tooltip displays details about the shape value on mouse hover. Tooltips are also displayed for markers and bubbles on a map.
Drill down
Drill down in the rendered JavaScript Maps to display shape data located on another layer. For example, the initial layer may render the world map and on clicking a particular continent, the continent alone will render separately on another layer.
Selection and highlight
Select a particular shape on mouse click or highlight on mouse hover to bring the focus to shapes on a map.
Custom shapes
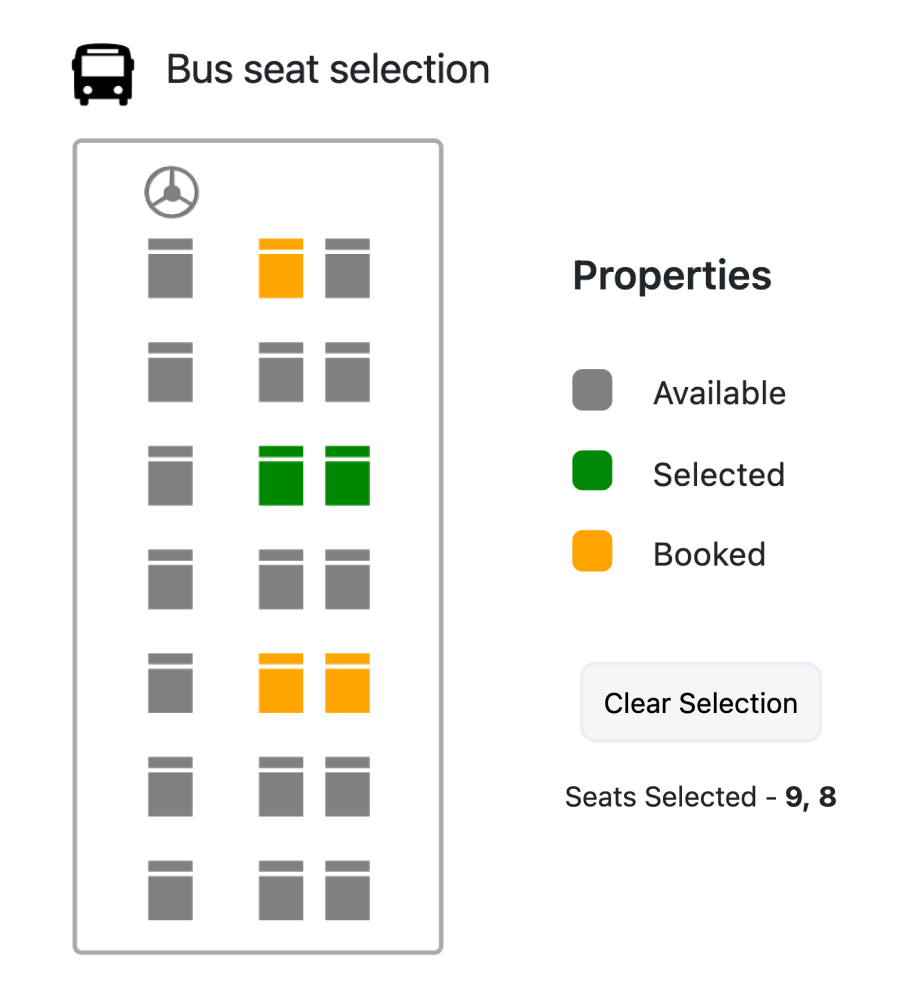
Create a JavaScript map with custom shapes by rendering customized GeoJSON data to indicate building infrastructure, points of interest, flight seat arrangement, sports stadiums, and more.

Annotation
Display any HTML element as an annotation at a specific point of interest on a map. For example, place a compass image on the map using an annotation. Add multiple annotations to a map.
Projection
Change the projection of the default rendered map. The HTML5 JavaScript Maps control supports various types of projections: Mercator, Equirectangular, Miller, Eckert 3, Eckert 5, Eckert 6, Winkel 3, and Aitoff.

JavaScript Maps rendered in Mercator projection.

JavaScript Maps rendered in Equirectangular projection.

JavaScript Maps rendered in Miller projection.

JavaScript Maps rendered in Eckert 3 projection.

JavaScript Maps rendered in Eckert 5 projection.

JavaScript Maps rendered in Eckert 6 projection.

JavaScript Maps rendered in Winkel 3 projection.

JavaScript Maps rendered in Aitoff projection.

Title and subtitle
Add a title and subtitle to visualize additional information on a map. Fonts and alignment used in the title and subtitle can also be customized.
Appearance
Customize the look and feel of a JavaScript map by changing the fill color, background, border, and opacity of shapes. Almost all the elements in JavaScript Maps are customizable. The control also provides built-in palettes with customizable options by default.


State persistence
State persistence allows the Maps component to maintain state by storing the most recent model value in browser cookies. When the appropriate setting is enabled, some of the Maps component model values are preserved even after the page is refreshed.
Exporting
Export or print the rendered JavaScript Maps to save a local copy for further use.

Export
Export the JavaScript Maps control to a PDF document or in image formats such as SVG, PNG, and JPEG on the client side.
Accessibility

Keyboard navigation
The JavaScript Maps library ensures that every element is keyboard accessible. Major features like zooming, panning, shape selection, and drill down can be performed using just keyboard shortcuts, no mouse interaction required. This helps in creating highly accessible applications.

Accessibility
The JavaScript Maps library has complete WAI-ARIA accessibility support. The Maps UI includes high-contrast visual elements that help visually impaired people have the best viewing experience. Also, valid UI descriptions are easily accessible through assistive technologies such as screen readers.
Other supported frameworks
The Maps is available for the Blazor, React, Angular, and Vue frameworks. Explore its platform-specific options through the following links:
Supported browsers
The JavaScript Maps library works well with all modern web browsers, including Chrome, Firefox, Edge, Safari, and Opera.

Not sure how to create your first map with the JavaScript Maps library? Our documentation can help.
I’d love to read it now140+ JAVASCRIPT UI CONTROLS
SMART COMPONENTS
GRIDS
DATA VISUALIZATION
DROPDOWNS
FILE VIEWERS & EDITORS
BUTTONS
INTERACTIVE CHAT
INPUTS
NAVIGATION
NOTIFICATIONS
Standalone UI SDKs
Integrate the DataGrid, Chart, Scheduler, Gantt, Rich Text Editor, File Manager, and Diagram UI components into applications to enable rich interaction and visualization, delivering a seamless user experience.
Document Solutions
Integrate the PDF Viewer, DOCX Editor, Spreadsheet Editor, and document-processing libraries into the JavaScript applications to enable a smooth user experience.
Frequently Asked Questions
Why should you choose the Syncfusion JavaScript Maps library?
The JavaScript Maps component offers the following:
Geometric or custom shapes are rendered using GeoJSON data.
Maps from map providers like Bing Maps, OpenStreetMap, and Google Maps can be rendered.
Markers highlight specified latitudes and longitudes on maps.
Fast zooming and panning performance and elegant animation.
- Simple configuration and API.
- Support for all modern browsers.
- Touch-friendly and responsive UI.
Expansive learning resources such as demos, documentation, and videos help you learn quickly and get started fast.
Where can I find the Syncfusion JavaScript Maps library demo?
You can find our JavaScript Maps library demo, which demonstrates how to render and configure the Maps component.
Can I download and utilize the Syncfusion JavaScript Maps library for free?
No, this is a commercial product and requires a paid license. However, a free community license is also available for companies and individuals whose organizations have less than $1 million USD in annual gross revenue, 5 or fewer developers, and 10 or fewer total employees.
How do I get started with Syncfusion JavaScript Maps library?
A good place to start would be our comprehensive getting started documentation.
Our Customers Love Us
Having an excellent set of tools and a great support team, Syncfusion® reduces customers’ development time.Here are some of their experiences.

Light and fast
I like JS controls the most, they are simple to use and easy to integrate to JS apps. In ASP.NET MVC your controls behave very nice, although I consider I have more control by using the JS version

Alexis A,

Software Architect, Small-Business
Syncfusion - Great controls and terrific support
The best in Syncfusion is the attention and efforts spent by the technical support whenever needed. It's priceless. The Syncfusion controls are really usefull to accelerate my projects, mainly those things related to UI.

David B,
CEO, Small-Business
See Real Success Stories
Developers around the world trust Syncfusion’s Essential Studio to simplify complex projects and speed up delivery. With a vast library of UI controls, powerful SDKs, and reliable support, Essential Studio helps teams build enterprise-ready applications with confidence.
Read Our Customer StoriesIndustry
Software development
75% Cost reduction
50% Faster development
Industry
Utilities (oil and gas)

450+ hours saved
Streamlined processes and hours of development effort saved.

Advanced, flexible features
Empowered users through robust and versatile functionality.
Industry
Software and technology
1000+ of hours saved
Accelerated development with enterprise-ready UI components.

Efficient file management
Streamlined workflows with document libraries without building them from scratch.
Industry
Software and technology

2 Years of delay avoided
Two years of delays prevented with proactive planning.

On-time delivery
Projects delivered on schedule using trusted controls.
Industry
IT services and IT consulting

Improved performance
Large datasets handled with easy customization and quick debugging.

Highly customizable
Plug-and-play controls with quick template integration.
Industry
Professional services
Instant access
Quick availability of features and resources.
Reduced dependencies
Fewer dependencies for faster development.
Rated by users across the globe
Syncfusion JavaScript Maps Library Resources


UI Kits
 Figma Download
Figma Download
Awards
Greatness—it’s one thing to say you have it, but it means more when others recognize it. Syncfusion® is proud to hold the following industry awards.


Recent activities in JavaScript Maps Library blogs
The JavaScript Maps Library blog posts will guide you in building your first app with JavaScript controls. They provide problem-solving strategies, describe features and functionalities, announce new feature releases, explain best practices, and showcase example scenarios. Explore our latest posts on our blog channels for JavaScript Maps Library updates.







