JavaScript Sankey Diagram - Interactive Data Visualization
- Visualize and examine complex flow systems using interconnected nodes and links.
- Engage with the Sankey Diagram through interactive features such as tooltips and legends.
- Visualize data effectively with support for both vertical and horizontal orientations.
Trusted by the world’s leading companies

Overview
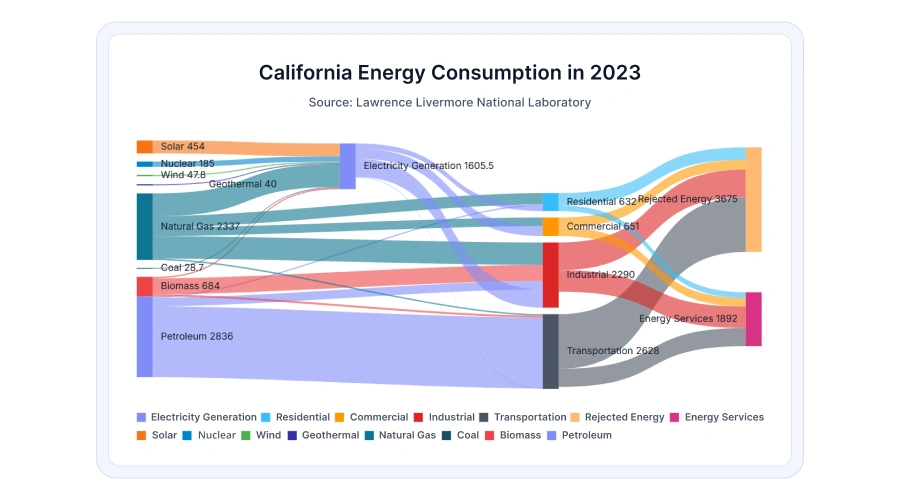
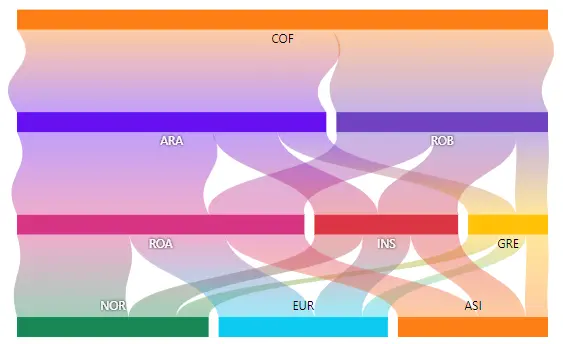
The JavaScript Sankey Diagram is a flow-oriented visualization that displays values proportionally, highlighting how data moves or transfers between different stages of a process. It is a robust solution for representing complex systems, energy distribution, or any workflow that involves transitions across stages.
Why choose the Syncfusion JavaScript Sankey Diagram?
Interactive Sankey Diagram
Interactive tooltip behavior allows users to explore the Sankey Diagram and view detailed information about nodes and their connecting links.
Rich feature set
The JavaScript Sankey Diagram includes support for legends, layout orientations, labels, titles, themes, events, customizable nodes and links, as well as printing and export options.
Adapts to any resolution
The Sankey Diagram has a highly responsive layout that adapts seamlessly to desktops and mobile devices. It performs consistently across iOS, Android, and Windows platforms.
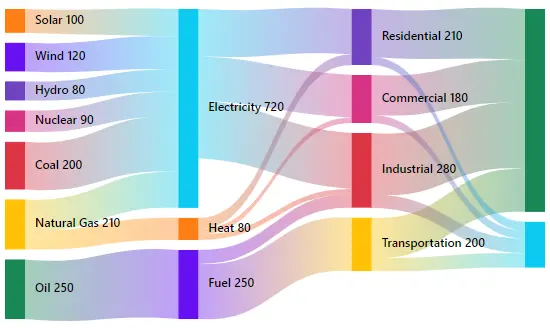
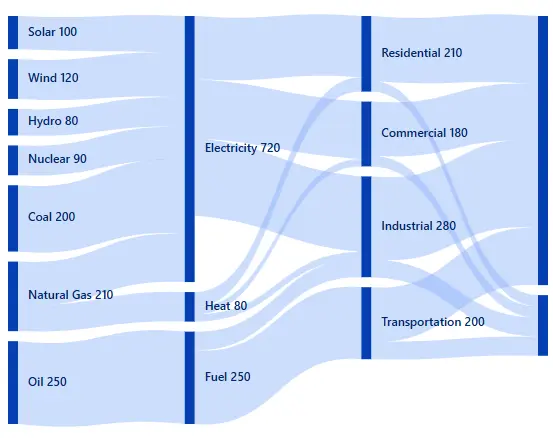
Attractive, customizable themes
Pick from visually modern designs with multiple built-in themes, including Material 3, Fluent 2, Tailwind CSS, Bootstrap, Material, and Fabric.
Elegant animation
The Sankey Diagram features smooth and refined animations that display data changes with fluid transitions.
JavaScript Sankey Diagram code example
You can begin using the JavaScript Sankey Diagram quickly with only a few lines of HTML and JavaScript code, as shown below. Additionally, explore this JavaScript Sankey Diagram sample to learn how to render and configure the component effectively.
<!DOCTYPE html>
<html>
<head></head>
<body>
    <div id="container">
     <div id="sankey"></div>
    </div>
</body>
</html>
import { Sankey, SankeyLegend } from '@syncfusion/ej2-charts';
Sankey.Inject(SankeyLegend);
const nodes = [
{ id: 'Female', label: { text: 'Female (58%)' } },
{ id: 'Male', label: { text: 'Male (42%)' } },
{ id: 'Tablet', label: { text: 'Tablet (12%)' } },
{ id: 'Mobile', label: { text: 'Mobile (40%)' } },
{ id: 'Desktop', label: { text: 'Desktop (48%)' } },
{ id: '< 18', label: { text: '< 18 years (8%)' } },
{ id: '18-26', label: { text: '18-26 years (35%)' } },
{ id: '27-40', label: { text: '27-40 years (38%)' } },
{ id: '> 40', label: { text: '> 40 years (19%)' } }
];
const links = [
{ sourceId: 'Female', targetId: 'Tablet', value: 12 },
{ sourceId: 'Female', targetId: 'Mobile', value: 14 },
{ sourceId: 'Female', targetId: 'Desktop', value: 32 },
{ sourceId: 'Male', targetId: 'Mobile', value: 26 },
{ sourceId: 'Male', targetId: 'Desktop', value: 16 },
{ sourceId: 'Tablet', targetId: '< 18', value: 4 },
{ sourceId: 'Tablet', targetId: '> 40', value: 8 },
{ sourceId: 'Mobile', targetId: '< 18', value: 4 },
{ sourceId: 'Mobile', targetId: '18-26', value: 24 },
{ sourceId: 'Mobile', targetId: '27-40', value: 10 },
{ sourceId: 'Mobile', targetId: '> 40', value: 2 },
{ sourceId: 'Desktop', targetId: '18-26', value: 11 },
{ sourceId: 'Desktop', targetId: '27-40', value: 28 },
{ sourceId: 'Desktop', targetId: '> 40', value: 9 }
]
let sankey: Sankey = new Sankey({
title: "Device Usage",
nodes: nodes,
links: links,
nodeStyle: { width: 30, padding: 10 },
linkStyle: { colorType: 'Source' },
legendSettings: { visible: true, position: 'Bottom' }
}, '#sankey');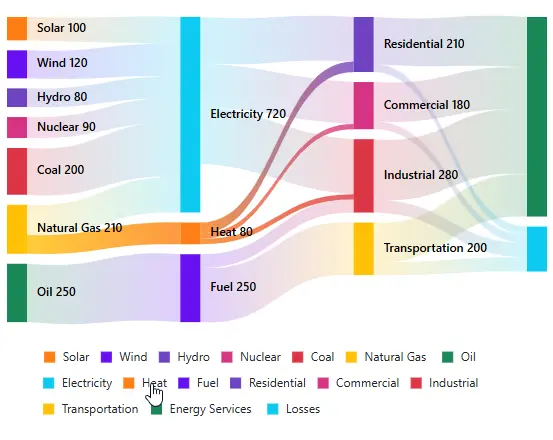
Legends
The JavaScript Sankey Diagram supports configurable legends that supply additional context about nodes. When hovering over a legend item, the associated data flow paths are automatically highlighted.
Tooltips
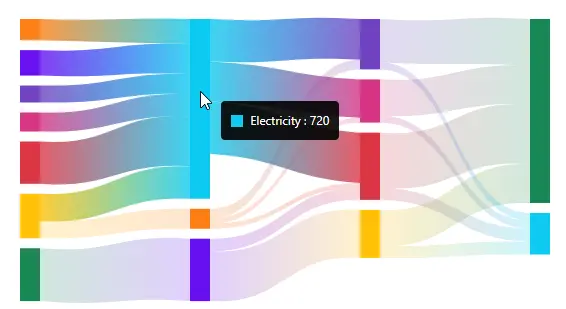
The Sankey Diagram provides a tooltip that displays detailed information about node and link values when the mouse pointer moves over them.
Print and export
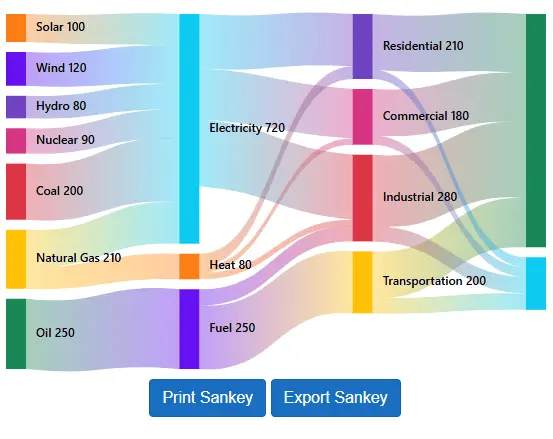
Export the JavaScript Sankey Diagram as a PDF file or in image formats such as PNG and JPEG on the client side. The rendered diagram can also be printed directly from the browser.
Orientation
The Sankey Diagram supports both horizontal and vertical layouts, allowing flexible visualization based on the data’s structure and directional flow.
Node labels
Labels can be applied to nodes to display descriptive information, improving overall clarity.
Customization
Built-in APIs enable customization of node widths and allow control over the colors of nodes, links, and labels to match your design requirements.
Accessibility

Keyboard navigation
All Sankey Diagram elements are fully operable using keyboard input. Core interactions, including legend highlighting, can be performed without mouse usage, providing an accessible experience.

Screen readers
The Sankey Diagram offers full WAI-ARIA compliance, ensuring compatibility with screen readers and other assistive technologies. High-contrast visuals support users with low vision, while accessible UI descriptions further improve usability.

Right to left (RTL)
RTL rendering displays the Sankey Diagram’s layout and text from right to left, enhancing usability and accessibility for users working with right-to-left languages.
Not sure how to create your first JavaScript Sankey Diagram component? Our documentation can help.
I’d love to read it now140+ JAVASCRIPT UI CONTROLS
ALL CONTROLS
SMART COMPONENTS
GRIDS
DATA VISUALIZATION
DROPDOWNS
FILE VIEWERS & EDITORS
BUTTONS
INTERACTIVE CHAT
INPUTS
NAVIGATION
FORMS
NOTIFICATIONS
Standalone UI SDKs
Integrate the DataGrid, Chart, Scheduler, Gantt, Rich Text Editor, File Manager, and Diagram UI components into applications to enable rich interaction and visualization, delivering a seamless user experience.
Document Solutions
Integrate the PDF Viewer, DOCX Editor, Spreadsheet Editor, and document-processing libraries into the JavaScript applications to enable a smooth user experience.
Frequently Asked Questions
Why should you choose the Syncfusion® JavaScript Sankey Diagram component?
With the Syncfusion JavaScript Sankey Diagram control, you can:
- Visualize and analyze complex flow systems with nodes and links.
- Enjoy simple configuration and APIs.
- Deploy confidently to all modern browsers.
- Implement a touch-friendly and responsive component.
Take advantage of expansive learning resources such as demos and documentation to get started quickly.
Can I download and utilize the Syncfusion JavaScript Sankey Diagram component for free?
No, this is a commercial product and requires a paid license. However, a free community license is also available for companies and individuals whose organizations have less than $1 million USD in annual gross revenue, 5 or fewer developers, and 10 or fewer total employees.
How do I get started with Syncfusion JavaScript Sankey Diagram?
A good place to start would be our comprehensive getting started documentation.
Where can I find the Syncfusion JavaScript Sankey Diagram demo?
You can find our JavaScript Sankey Diagram demo here.
Our Customers Love Us
Having an excellent set of tools and a great support team, Syncfusion® reduces customers’ development time.Here are some of their experiences.

Light and fast
I like JS controls the most, they are simple to use and easy to integrate to JS apps. In ASP.NET MVC your controls behave very nice, although I consider I have more control by using the JS version

Alexis A,

Software Architect, Small-Business
Syncfusion - Great controls and terrific support
The best in Syncfusion is the attention and efforts spent by the technical support whenever needed. It's priceless. The Syncfusion controls are really usefull to accelerate my projects, mainly those things related to UI.

David B,
CEO, Small-Business
See Real Success Stories
Developers around the world trust Syncfusion’s Essential Studio to simplify complex projects and speed up delivery. With a vast library of UI controls, powerful SDKs, and reliable support, Essential Studio helps teams build enterprise-ready applications with confidence.
Read Our Customer StoriesIndustry
Software development
75% Cost reduction
50% Faster development
Industry
Utilities (oil and gas)
450+ hours saved
Streamlined processes and hours of development effort saved.
Advanced, flexible features
Empowered users through robust and versatile functionality.
Industry
Software and technology
1000+ of hours saved
Accelerated development with enterprise-ready UI components.
Efficient file management
Streamlined workflows with document libraries without building them from scratch.
Industry
Software and technology
2 Years of delay avoided
Two years of delays prevented with proactive planning.
On-time delivery
Projects delivered on schedule using trusted controls.
Industry
IT services and IT consulting
Improved performance
Large datasets handled with easy customization and quick debugging.
Highly customizable
Plug-and-play controls with quick template integration.
Industry
Professional services
Instant access
Quick availability of features and resources.
Reduced dependencies
Fewer dependencies for faster development.
Rated by users across the globe
Syncfusion JavaScript Sankey Diagram resources


UI Kits
 Figma download
Figma download
Awards
Greatness—it’s one thing to say you have it, but it means more when others recognize it. Syncfusion® is proud to hold the following industry awards.

