Overview
The ASP.NET MVC Pivot Table can be connected to multidimensional data (OLAP) that is organized into dimensions, hierarchies, measures, named sets, etc. Its result can be visualized in both tabular (pivot table) and graphical (pivot chart) formats. End users can customize its report on the fly with the help of grouping bar and field list. Users can also store the report for later use.
OLAP cube
OLAP cube is a multidimensional array of data formed by its elements such as dimensions, hierarchies, levels, members, measures, and named sets. With the help of the field list UI, end users can visualize and use the OLAP cube elements at runtime.
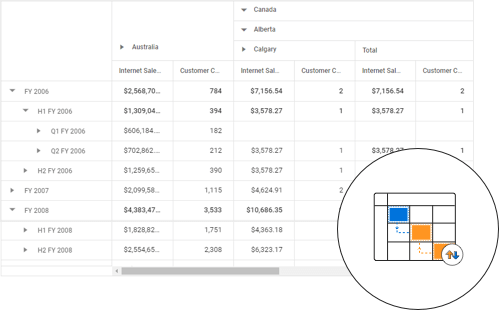
Drill down and drill up
Built-in support for drill down (expand) and drill up (collapse) has been provided to visualize data in both abstract and detailed views.
Slice and dice
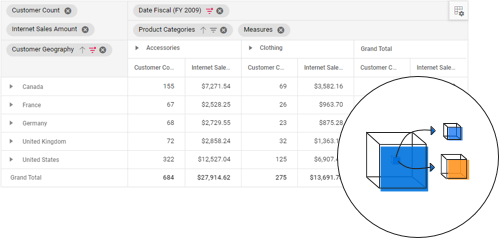
With slice and dice, the end users can create a new view by selecting dimensions and measures from the OLAP cube and filtering them.
Virtualization
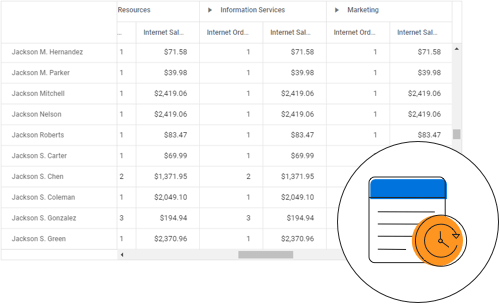
In the ASP.NET MVC Pivot Table, support has been provided to bring data to the browser with the help of paging MDX query while scrolling and to render the component without any performance constraints.
Calculated members and measures
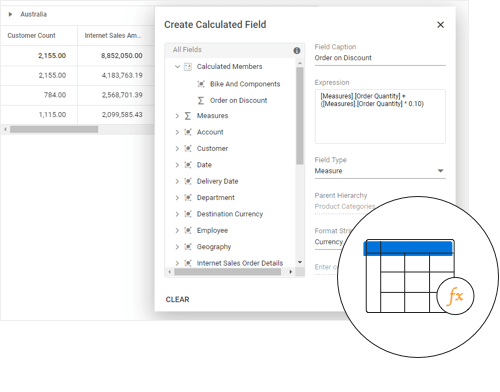
A built-in UI creates and displays dimensions and measures as needed. The dynamically created members and measures can be bound to the report in order to visualize them in the Pivot Table.
Named sets
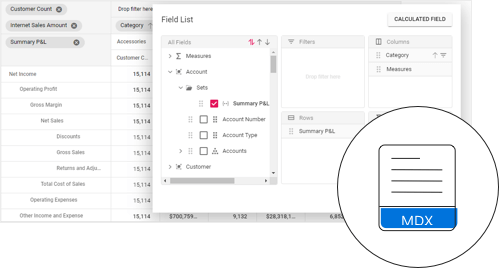
Named sets are dimension members created from predefined MDX expressions in the OLAP cube.
Drill through
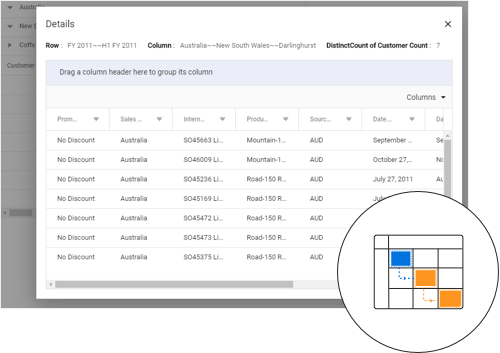
End users can now retrieve the underlying raw data of any aggregated value cell and visualize it in the grid component.
Measure groups
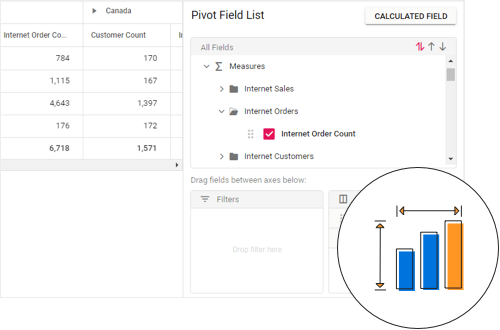
Organize measures belonging to the same underlying fact table in a group.
140+ ASP.NET MVC UI CONTROLS







