ASP.NET MVC Sankey Diagram – Interactive Data Visualization
- Understand and evaluate complex flow relationships using interconnected nodes and links.
- Engage with the Sankey Diagram through interactive capabilities such as tooltips, legends, and more.
- Deliver clear and consistent data visualization with support for both horizontal and vertical orientations.
Trusted by the world’s leading companies

Overview
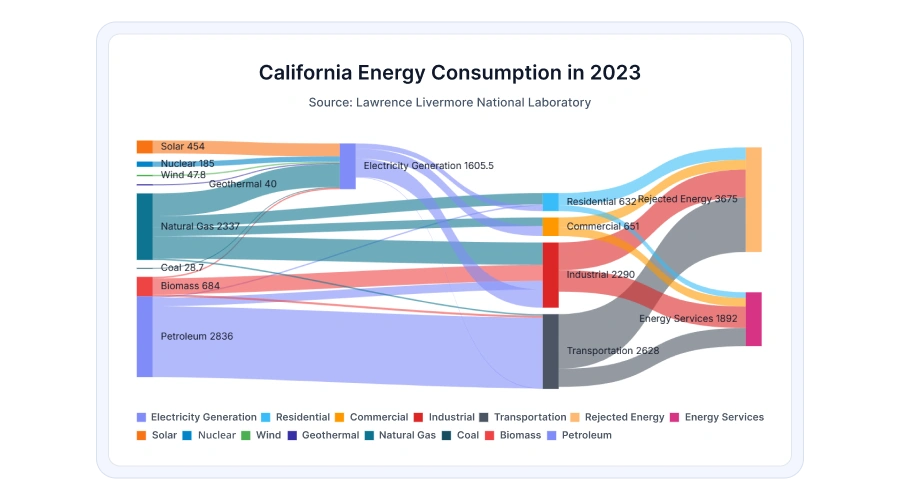
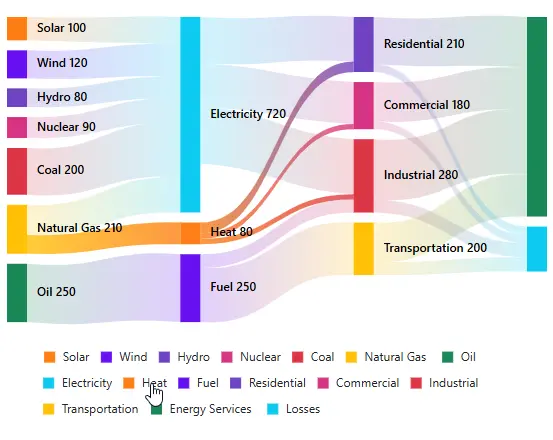
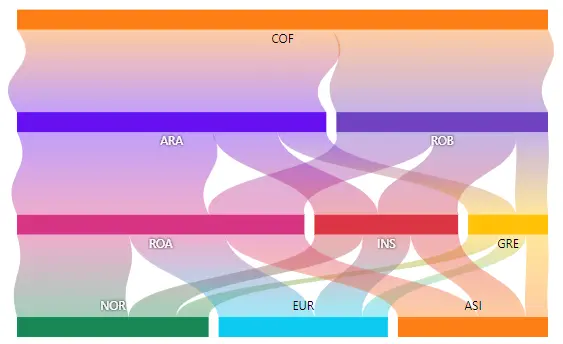
The ASP.NET MVC Sankey Diagram is a proportional flow visualization that illustrates the movement or transfer of values between various stages in a process. It is ideal for representing complex workflows, energy distribution, and any scenario involving directional data flow across multiple stages.
Why choose the Syncfusion ASP.NET MVC Sankey Diagram?
Interactive Sankey Diagram
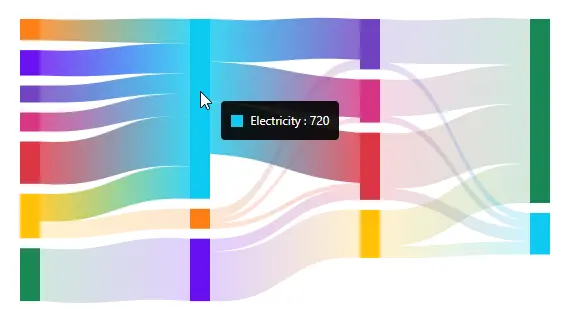
The tooltip-based interaction allows users to explore the Sankey Diagram and view detailed information related to nodes and connecting links.
Rich feature set
The ASP.NET MVC Sankey Diagram offers support for legends, layout orientations, labels, titles, themes, events, customizable nodes and links, along with printing and export functionality.
Adapts to any resolution
The Sankey Diagram is built with a responsive layout and optimized design for desktops, touch-enabled devices, and mobile phones. It performs reliably on iOS, Android, and Windows platforms.
Attractive, customizable themes
Provides modern visual styles with multiple built-in themes, including Material 3, Fluent 2, Tailwind CSS, Bootstrap, Material, and Fabric.
Elegant animation
The Sankey Diagram features smooth animations that present data transitions clearly and naturally.
ASP.NET MVC Sankey Diagram code example
Quickly begin using the ASP.NET MVC Sankey Diagram with just a few lines of CSHTML and C# code, as demonstrated below. You can also explore our ASP.NET MVC Sankey sample to learn how to render and configure the component.
@Html.EJS().Sankey("sankey-container").Title("Device Usage").LinkStyle(ls => ls.ColorType(Syncfusion.EJ2.Charts.ColorType.Source)).NodeStyle(nodeStyle => nodeStyle.Width(30).Padding(10)).LegendSettings(legend => legend.Visible(true).Position(Syncfusion.EJ2.Charts.LegendPosition.Bottom)).Nodes((List<SankeyNode>)ViewData["SankeyNodes"]).Links((List<SankeyLink>)ViewData["SankeyLinks"]).Render();public class HomeController : Controller
{
public ActionResult Index()
{
List<SankeyNode> nodes = new List<SankeyNode>
{
new SankeyNode { id = "Female", label = new { text = "Female (58%)" } },
new SankeyNode { id = "Male", label = new { text = "Male (42%)" } },
new SankeyNode { id = "Tablet", label = new { text = "Tablet (12%)" } },
new SankeyNode { id = "Mobile", label = new { text = "Mobile (40%)" } },
new SankeyNode { id = "Desktop", label = new { text = "Desktop (48%)" } },
new SankeyNode { id = "< 18", label = new { text = "< 18 years (8%)" } },
new SankeyNode { id = "18-26", label = new { text = "18-26 years (35%)" } },
new SankeyNode { id = "27-40", label = new { text = "27-40 years (38%)" } },
new SankeyNode { id = "> 40", label = new { text = "> 40 years (19%)" } }
};
List<SankeyLink> links = new List<SankeyLink>
{
new SankeyLink { sourceId = "Female", targetId = "Tablet", value = 12 },
new SankeyLink { sourceId = "Female", targetId = "Mobile", value = 14 },
new SankeyLink { sourceId = "Female", targetId = "Desktop", value = 32 },
new SankeyLink { sourceId = "Male", targetId = "Mobile", value = 26 },
new SankeyLink { sourceId = "Male", targetId = "Desktop", value = 16 },
new SankeyLink { sourceId = "Tablet", targetId = "< 18", value = 4 },
new SankeyLink { sourceId = "Tablet", targetId = "> 40", value = 8 },
new SankeyLink { sourceId = "Mobile", targetId = "< 18", value = 4 },
new SankeyLink { sourceId = "Mobile", targetId = "18-26", value = 24 },
new SankeyLink { sourceId = "Mobile", targetId = "27-40", value = 10 },
new SankeyLink { sourceId = "Mobile", targetId = "> 40", value = 2 },
new SankeyLink { sourceId = "Desktop", targetId = "18-26", value = 11 },
new SankeyLink { sourceId = "Desktop", targetId = "27-40", value = 28 },
new SankeyLink { sourceId = "Desktop", targetId = "> 40", value = 9 }
};
ViewData["SankeyNodes"] = nodes;
ViewData["SankeyLinks"] = links;
return View();
}
}
Legend
The ASP.NET MVC Sankey Diagram includes customizable legends that supply additional context about nodes. Hovering over a legend item highlights the associated data flow connections.
Tooltips
The Sankey Diagram provides tooltip options that display detailed information about node and link values when the pointer hovers over them.
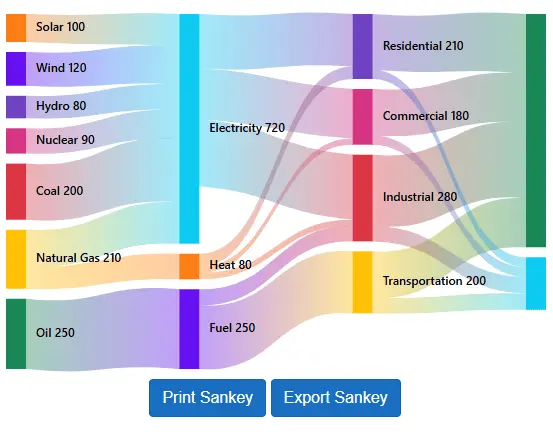
Print and export
Export the ASP.NET MVC Sankey Diagram as a PDF file or as image formats such as PNG and JPEG on the client side. The rendered diagram can also be printed directly from the browser.
Orientation
The Sankey Diagram supports both horizontal and vertical layouts, offering flexibility to visualize data based on flow direction and layout requirements.

Node labels
The Sankey Diagram supports node labels that can be used to annotate individual stages, improving clarity and overall readability.
Customization
Built in APIs allow you to customize node widths and adjust the colors of nodes, links, and labels, enabling visual alignment with your application’s design.

Accessibility

Keyboard navigation
Every element in the Sankey Diagram is fully accessible using keyboard input. Key interactions, including legend highlighting, can be performed without a mouse, ensuring an inclusive user experience.

Screen readers
The Sankey Diagram is fully compliant with WAI ARIA standards, ensuring compatibility with screen readers and other assistive technologies. High contrast UI elements support users with low vision, and accessible UI descriptions further enhance usability.

Right to left (RTL) support
RTL rendering displays the Sankey Diagram layout and text from right to left, improving accessibility and usability for users who work with RTL languages.
Not sure how to create your first ASP.NET MVC Sankey Diagram component? Our documentation can help.
I’d love to read it now140+ ASP.NET MVC UI CONTROLS
ALL CONTROLS
GRIDS
DATA VISUALIZATION
FILE VIEWERS & EDITORS
DROPDOWNS
NAVIGATION
INPUTS
BUTTONS
NOTIFICATIONS
INTERACTIVE CHAT
Standalone UI SDKs
Integrate the DataGrid, Chart, Scheduler, Gantt, Rich Text Editor, File Manager, and Diagram UI components into applications to enable rich interaction and visualization, delivering a seamless user experience.
Document Solutions
Integrate the PDF Viewer, DOCX Editor, Spreadsheet Editor, and document-processing libraries into the ASP.NET MVC applications to enable a smooth user experience.
Frequently Asked Questions
Why should you choose the Syncfusion® ASP.NET MVC Sankey Diagram component?
With the Syncfusion ASP.NET MVC Sankey Diagram control, you can:
- Visualize and analyze complex flow systems with nodes and links.
- Implement one of the best ASP.NET MVC Sankey Diagram components on the market.
- Enjoy simple configuration and APIs.
- Deploy confidently to all modern browsers.
- Implement a touch-friendly and responsive component.
- Take advantage of expansive learning resources such as demos and documentation to get started quickly.
Where can I find the Syncfusion ASP.NET MVC Sankey Diagram demo?
You can find our ASP.NET MVC Sankey demo here, which demonstrates how to render and configure the Sankey Diagram.
Can I download and utilize the Syncfusion ASP.NET MVC Sankey Diagram component for free?
No, this is a commercial product and requires a paid license. However, a free community license is also available for companies and individuals whose organizations have less than $1 million USD in annual gross revenue, 5 or fewer developers, and 10 or fewer total employees.
How do I get started with Syncfusion ASP.NET MVC Sankey Diagram?
A good place to start would be our comprehensive getting started documentation.
Our Customers Love Us
Having an excellent set of tools and a great support team, Syncfusion® reduces customers’ development time.Here are some of their experiences.

Very good and quick support
A very vast range of cross-platform UI controls for mobile development. Using professionally build components safes development time and make UI look great

Kostadin N,

Consultant, Small-Business
Great experience so far!
The components look great and I haven't yet encountered anything that is simply not possible using Syncfusion. Building a SaaS application for events management. Syncfusion has helped me to achieve professional UI with all the key front end components from one vendor.

Ian M,
Small-Business
See Real Success Stories
Developers around the world trust Syncfusion’s Essential Studio to simplify complex projects and speed up delivery. With a vast library of UI controls, powerful SDKs, and reliable support, Essential Studio helps teams build enterprise-ready applications with confidence.
Read Our Customer StoriesIndustry
Software development
75% Cost reduction
50% Faster development
Industry
Utilities (oil and gas)
450+ hours saved
Streamlined processes and hours of development effort saved.
Advanced, flexible features
Empowered users through robust and versatile functionality.
Industry
Software and technology
1000+ of hours saved
Accelerated development with enterprise-ready UI components.
Efficient file management
Streamlined workflows with document libraries without building them from scratch.
Industry
Software and technology
2 Years of delay avoided
Two years of delays prevented with proactive planning.
On-time delivery
Projects delivered on schedule using trusted controls.
Industry
IT services and IT consulting
Improved performance
Large datasets handled with easy customization and quick debugging.
Highly customizable
Plug-and-play controls with quick template integration.
Industry
Professional services
Instant access
Quick availability of features and resources.
Reduced dependencies
Fewer dependencies for faster development.
Rated by users across the globe
Syncfusion ASP.NET MVC Resources
Learning
 Documentation
 Documentation


Awards
Greatness—it’s one thing to say you have it, but it means more when others recognize it. Syncfusion® is proud to hold the following industry awards.

