Interactive WinForms Map Control
- Graphically represent geographical points from shape-files.
- Place pins on the map to show current or specific locations.
- Utilize interactive zooming, selecting, and tooltips.
.NET 10 support now available
Trusted by the world’s leading companies

Overview
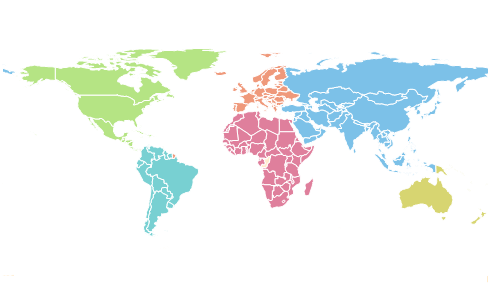
The WinForms Map control is a powerful data visualization component that displays statistical information for a geographical area. It has highly interactive and customizable features such as zooming, panning, selecting, markers, bubbles, and color mapping. Using the Map control, you can render various types of maps, such as sales, political boundary, weather, electoral, and route.
Shape layers
Render geographical shapes or custom shapes in the WinForms Map.
Data
Bind shapefiles (.shp) and GeoJSON (.json) data to maps to render any geometric shape.

Customization
Customize the default style of a shape using the color, stroke, and thickness properties.

Custom shapes
Render any custom shape to represent building infrastructure, a sports stadium, plane or bus seat arrangements, and more.
Sublayer
Load multiple shape files in a single map view. For example, add a sublayer over a main shape layer to view geographic features such as rivers, valleys, and cities.
Data labels
Easily annotate WinForms Map shapes with labels to improve the readability of a particular shape’s name. Customize the look and feel of default labels using font style, size, and color properties.

Heat map
Produce a heat map by customizing shape colors based on the underlying shape value.
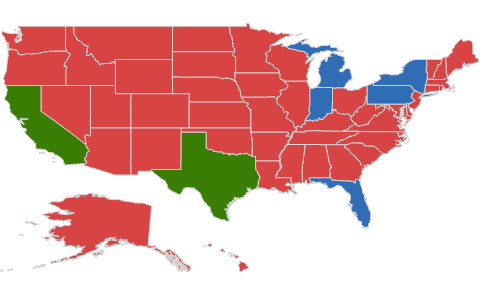
Equal color mapping
Equal color mapping differentiates a shape’s fill color based on its underlying value and color. For example, apply colors to states based on their winning political candidates.

Range color mapping
Apply colors to shapes by comparing their values with specified numeric ranges. For example, apply colors to states based on their population density.
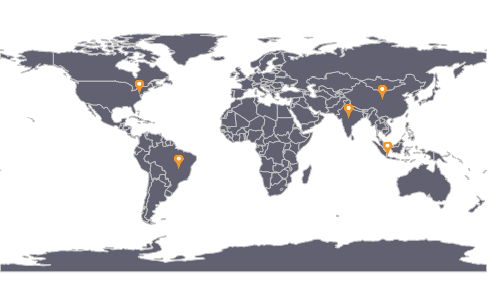
Map annotations
Map annotations allow you to denote a place with symbols, like pins, or display a message at specific coordinates on a map.

Annotation types
You can draw shapes like circles, diamonds, rectangles, and squares to highlight a place.
Custom map annotation
Customize map annotations by adding images or any custom shape to highlight a location.
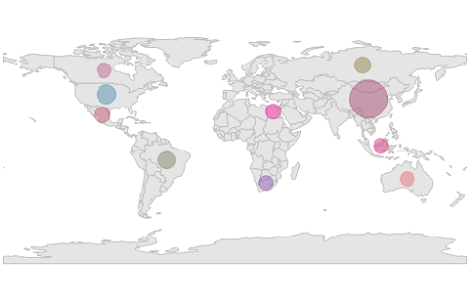
Map bubbles
Bubbles are used to add information to shapes, such as population density, land area, and more. They are rendered with various magnitudes and colors based on the underlying data values of the shapes.
Color customization
Customize the default color of a bubble and its transparency using the fill and opacity properties.

Size customization
Customize the minimum and maximum sizes of a bubble to enhance its readability.
User interactions
Interactive features, such as selecting, zooming, and panning, greatly enhance user experience.

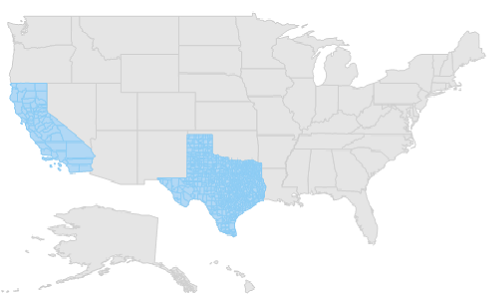
Selection
Select or highlight an area or shape to center the view over that area on a map.
Zooming and panning
Zooming allows users to get a closer look at a particular area, and panning allows them to move a map around to focus on different areas.
Tooltip
The tooltip control displays a pop-up with additional information about shapes, markers, and bubbles when the end user taps map elements.

WinForms Map Code Example
Easily get started with the WinForms Map using a few simple lines of C# code example as demonstrated below. Also explore our WinForms Map Example that shows you how to render and configure the Maps in WinForms.
using Syncfusion.Windows.Forms.Maps;
namespace WindowsFormsApplication1
{
    public partial class Form1 : Form
    {
        Maps mapsControl1;
        public Form1()
        {
            InitializeComponent();
            mapsControl1 = new Maps();
            this.mapsControl1.Name = "mapsControl1";
            this.mapsControl1.Size = new System.Drawing.Size(880, 585);
            this.ClientSize = new System.Drawing.Size(880, 585);
            ShapeFileLayer shapeLayer = new ShapeFileLayer();
            shapeLayer.Uri = "world-map.json"; // Follow the link to download - https://cdn.syncfusion.com/maps/map-data/world-map.json
            this.mapsControl1.Layers.Add(shapeLayer);
            this.Controls.Add(this.mapsControl1);
        }
    }
}
Not sure how to create your first WinForms Map? Our documentation can help.
I’d love to read it now120+ WINDOWS FORMS CONTROLS
ALL CONTROLS
CONVERSATIONAL UI
DATA VISUALIZATION
INPUT CONTROLS
NAVIGATION
DIALOGS & NOTIFICATION
LAYOUT
LISTS & DROPDOWN
CALENDAR
MISCELLANEOUS
FILE VIEWERS & EDITORS
BUTTONS
Standalone UI SDKs
Integrate the DataGrid, Chart, Scheduler, Gantt, Rich Text Editor, File Manager, and Diagram UI components into applications to enable rich interaction and visualization, delivering a seamless user experience.
Document Solutions
Integrate the PDF Viewer, DOCX Editor, Spreadsheet Editor, and document-processing libraries into the WinForms applications to enable a smooth user experience.
Frequently Asked Questions
Why should you choose Syncfusion WinForms Map?
Render geometric or custom shapes using the shapefile data(.shp).
Add map points on maps at the specified latitude and longitude position.
- Smooth zooming.
- One of the best WinForms Maps in the market that offers feature-rich UI to interact with the software.
- Simple configuration and API.
Expansive learning resources such as demos and documentation to learn quickly and get started with WinForms Map.
Where can I find the Syncfusion WinForms Map demo?
You can find our WinForms Map demo on
GitHub location.
Can I download and utilize the Syncfusion WinForms Map for free?
No, this is a commercial product and requires a paid license. However, a free community license is also available for companies and individuals whose organizations have less than $1 million USD in annual gross revenue, 5 or fewer developers, and 10 or fewer total employees.
How do I get started with Syncfusion WinForms Map?
A good place to start would be our comprehensive getting started documentation.
Our Customers Love Us
Having an excellent set of tools and a great support team, Syncfusion® reduces customers’ development time.Here are some of their experiences.

Excellent experience with Syncfusion!
Syncfusion is a product that makes life easier! I use it to create Blazor applications (server side and webassembly) and the controls speed up development a lot. Furthermore, if needed, it is possible to ask for direct support that is never long in coming!

Andrea Scarpante,

Sydea srl
The complete component set
It is the most complete component set available. Also very handy is the fact that there is a community edition, this gives me the opportunity to test thing at home without buying a separate license.

Johan Visser,

H and T Pawnbrokers
See Real Success Stories
Developers around the world trust Syncfusion’s Essential Studio to simplify complex projects and speed up delivery. With a vast library of UI controls, powerful SDKs, and reliable support, Essential Studio helps teams build enterprise-ready applications with confidence.
Read Our Customer StoriesIndustry
Software development
75% Cost reduction
50% Faster development
Industry
Utilities (oil and gas)
450+ hours saved
Streamlined processes and hours of development effort saved.
Advanced, flexible features
Empowered users through robust and versatile functionality.
Industry
Software and technology
1000+ of hours saved
Accelerated development with enterprise-ready UI components.
Efficient file management
Streamlined workflows with document libraries without building them from scratch.
Industry
Software and technology
2 Years of delay avoided
Two years of delays prevented with proactive planning.
On-time delivery
Projects delivered on schedule using trusted controls.
Industry
IT services and IT consulting
Improved performance
Large datasets handled with easy customization and quick debugging.
Highly customizable
Plug-and-play controls with quick template integration.
Industry
Professional services
Instant access
Quick availability of features and resources.
Reduced dependencies
Fewer dependencies for faster development.
Rated by users across the globe
Syncfusion Windows Forms Resources
Learning
 Documentation
 Documentation


Awards
Greatness—it’s one thing to say you have it, but it means more when others recognize it. Syncfusion® is proud to hold the following industry awards.

