Trusted by the world’s leading companies

Overview
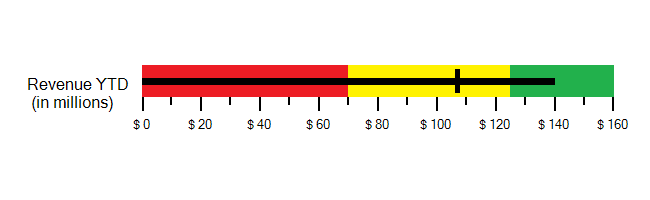
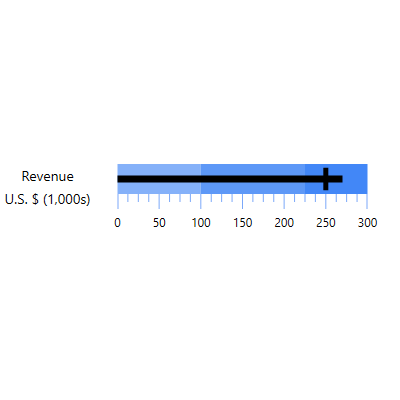
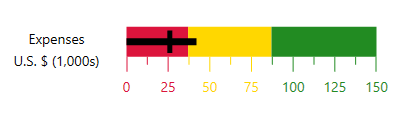
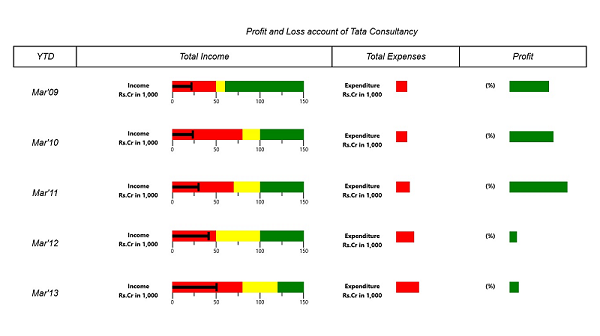
The UWP Bullet Graph control is a variation of the bar graph, which was developed as an alternative for dashboard gauges and meters. The bullet graph features a single, primary measure (for example, current year-to-date revenue), and compares that measure to one or more other measures to enrich its meaning (for example, compared to a target). It also has the ability to display the measures in the context of a qualitative range of performance such as poor, satisfactory, and good.
Orientation
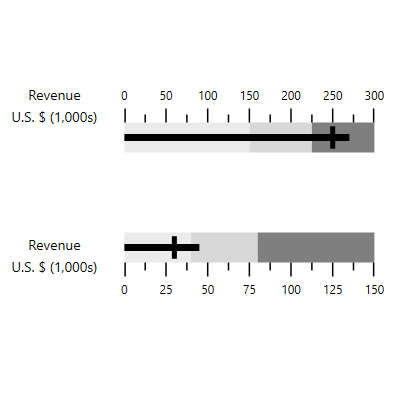
The view of a bullet graph can be changed, allowing users to force the application into a particular screen orientation.
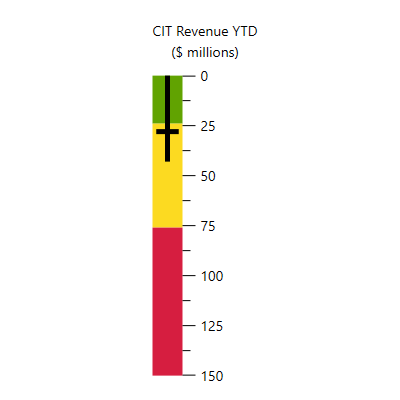
Vertical orientation
Change the UWP Bullet Graph control orientation to vertical.
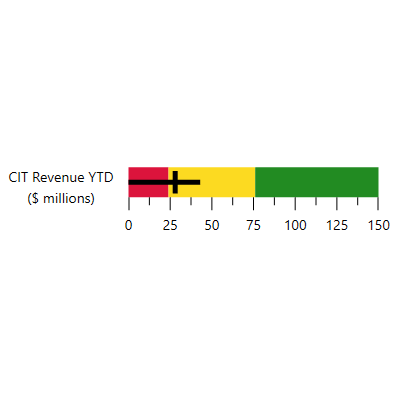
Horizontal orientation
Change the UWP Bullet Graph control orientation to horizontal.
Customization
UWP Bullet Graph’s elements are simple and easy to use in various business scenarios. The ticks, labels, and ranges inside the bullet graphs can be customized.
Ticks position
You can change the tick position to above, across, or below.
Ticks customization
Define your own style for minor and major ticks using the size, color, and thickness properties.
Label position
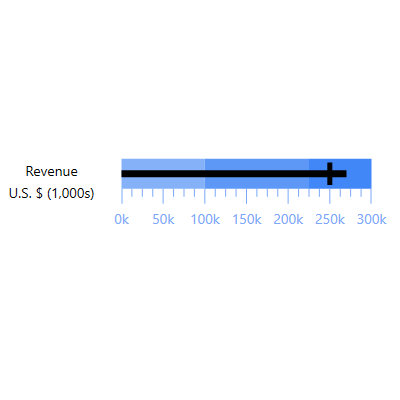
You can change the label position to above or below.
Label customization
Customize the look and feel of the default labels using size, format, and color properties.
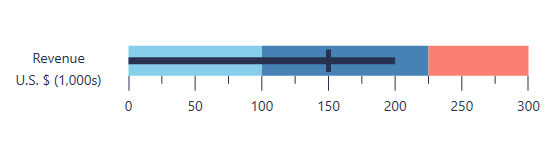
Bar settings (Performance/feature measure)
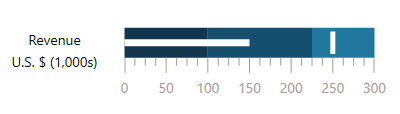
Feature and comparative are two types of measures available to compare the data. Customizing the bar stroke and thickness makes it easy to measure the progress or status of the development.
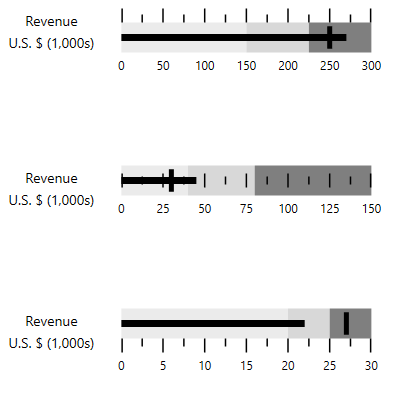
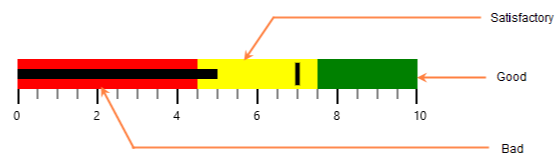
Range settings
Using the range settings, it is easy to integrate the control and better visualize application data.
Caption customization
You can customize the caption color and size of the caption property.
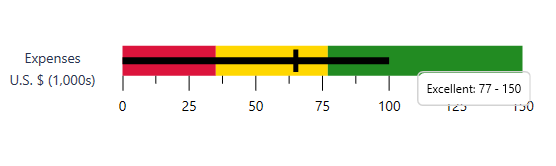
Tooltip
Bullet Graph provides tooltips that display brief descriptions of the qualitative ranges as well as the values of the quantitative measures.
Easy to evaluate
The progress or status of growth can be easily measured by using featured measure and comparative measure data values and other customizable elements.
Integration with Grid control
Integration with grid view allows users to present large amounts of data in a way that is easy to understand.
115+ UWP CONTROLS
ALL CONTROLS
GRIDS
DATA VISUALIZATION
INPUT CONTROLS
CALENDAR
NAVIGATION
BUSINESS INTELLIGENCE
LISTS & DROPDOWN
NOTIFICATION
MISCELLANEOUS
Data Science
FILE VIEWERS & EDITORS
Our Customers Love Us
Having an excellent set of tools and a great support team, Syncfusion® reduces customers’ development time.Here are some of their experiences.

Excellent experience with Syncfusion!
Syncfusion is a product that makes life easier! I use it to create Blazor applications (server side and webassembly) and the controls speed up development a lot. Furthermore, if needed, it is possible to ask for direct support that is never long in coming!

Andrea Scarpante,

Sydea srl
The complete component set
It is the most complete component set available. Also very handy is the fact that there is a community edition, this gives me the opportunity to test thing at home without buying a separate license.

Johan Visser,

H and T Pawnbrokers
See Real Success Stories
Developers around the world trust Syncfusion’s Essential Studio to simplify complex projects and speed up delivery. With a vast library of UI controls, powerful SDKs, and reliable support, Essential Studio helps teams build enterprise-ready applications with confidence.
Explore Case StudiesIndustry
Software development
75% Cost reduction
50% Faster development
Industry
Utilities (oil and gas)
450+ hours saved
Streamlined processes and hours of development effort saved.
Advanced, flexible features
Empowered users through robust and versatile functionality.
Industry
Software and technology
1000+ of hours saved
Accelerated development with enterprise-ready UI components.
Efficient file management
Streamlined workflows with document libraries without building them from scratch.
Industry
Software and technology
2 Years of delay avoided
Two years of delays prevented with proactive planning.
On-time delivery
Projects delivered on schedule using trusted controls.
Industry
IT services and IT consulting
Improved performance
Large datasets handled with easy customization and quick debugging.
Highly customizable
Plug-and-play controls with quick template integration.
Industry
Professional services
Instant access
Quick availability of features and resources.
Reduced dependencies
Fewer dependencies for faster development.
Rated by users across the globe
Syncfusion UWP Resources
Learning
 Documentation
 Documentation


Awards
Greatness—it’s one thing to say you have it, but it means more when others recognize it. Syncfusion® is proud to hold the following industry awards.

