Overview
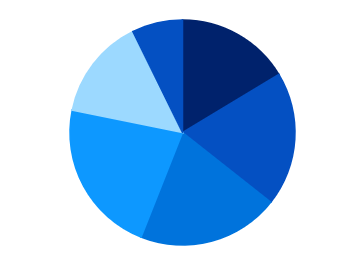
The WinUI Circular Charts control includes functionality for plotting pie and doughnut charts. Each chart type is easily configured with built-in support for creating stunning visual effects.
Circular charts
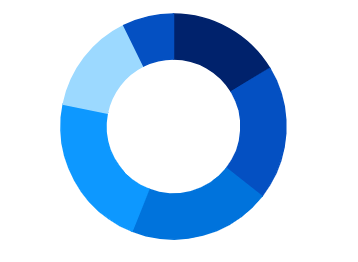
WinUI Doughnut Charts
A doughnut chart is similar to a pie chart, but with a hole at the center. It is intended for comparing the contribution of each data point to the whole.
Syncfusion WinUI DataViz & UI Controls
DATA VISUALIZATION
EDITORS
NOTIFICATION
MISCELLANEOUS
CONVERSATIONAL UI