Overview
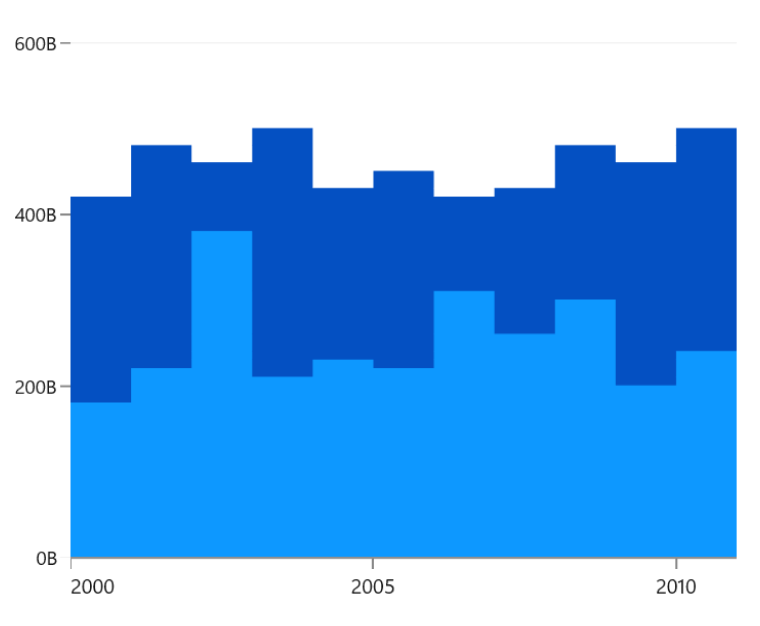
The WinUI Stacked Area Chart visualizes data with y-values stacked on top of each other in series order. It shows the relationship between individual values to the total sum of points. Users can create beautiful, animated, real-time, high-performance stacked area charts that also support interactive features such as zooming, scrolling, trackballs, and tooltips.
Key features

Grouped stacked chart
Group a series with another series using the GroupName in a chart. Group the series with different stacking names separately.

Vertical chart
Rotate the stacked area chart to plot data vertically and view it from a different perspective.

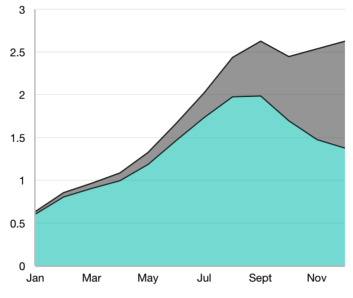
Empty/null point chart
Empty or null data points are elegantly handled in the stacked area chart.
UI styling
The WinUI Stacked Area chart offers UI customization through built-in APIs for adjusting colors and borders, enhancing its visual appeal with a distinctive look.
Code guideline
Get started with the WinUI Stacked Area Chart using a few simple lines of XAML and C# code example, as demonstrated below:
<Window x:Class="ChartExample.MainPage"
        xmlns="http://schemas.microsoft.com/winfx/2006/xaml/presentation"
        xmlns:x="http://schemas.microsoft.com/winfx/2006/xaml"
        xmlns:local="using:ChartExample"
        xmlns:d="http://schemas.microsoft.com/expression/blend/2008"
        xmlns:mc="http://schemas.openxmlformats.org/markup-compatibility/2006"
        xmlns:chart="using:Syncfusion.UI.Xaml.Charts"
        mc:Ignorable="d"
        Title="WinUI Stacked Area Chart" Height="450" Width="700">

    <Grid>
        <chart:SfCartesianChart Height="300" Width="500">
            <!--Setting DataContext-->
            <chart:SfCartesianChart.DataContext>
                <local:ViewModel/>
            </chart:SfCartesianChart.DataContext>

            <!--Initialize the horizontal axis for the WinUI Chart-->
            <chart:SfCartesianChart.XAxes>
                <chart:DateTimeAxis/>
            </chart:SfCartesianChart.XAxes>

            <!--Initialize the vertical axis for the WinUI Chart-->
            <chart:SfCartesianChart.YAxes>
                <chart:NumericalAxis/>
            </chart:SfCartesianChart.YAxes>

            <!--Adding Stacked Area Chart to the WinUI Chart-->

            <chart:StackedAreaSeries
                ItemsSource="{Binding Accidents}"
                XBindingPath="Month"
                YBindingPath="Bus">
            </chart:StackedAreaSeries>

            <chart:StackedAreaSeries
                ItemsSource="{Binding Accidents}"
                XBindingPath="Month"
                YBindingPath="Car">
            </chart:StackedAreaSeries>

            <chart:StackedAreaSeries
                ItemsSource="{Binding Accidents}"
                XBindingPath="Month"
                YBindingPath="Truck">
            </chart:StackedAreaSeries>
        </chart:SfCartesianChart>
    </Grid>
</Window>
public class StackingAreaChartModel
{
public DateTime Month { get; set; }
public double Bus { get; set; }
public double Car { get; set; }
public double Truck { get; set; }
}
public class ViewModel
{
public ObservableCollection<StackingAreaChartModel> Accidents { get; set; }
public ViewModel()
{
this.Accidents = new ObservableCollection<StackingAreaChartModel>();
DateTime mth = new DateTime(2011, 1, 1);
Accidents.Add(new StackingAreaChartModel() { Month = mth.AddMonths(6), Bus = 3, Car = 4, Truck = 5 });
Accidents.Add(new StackingAreaChartModel() { Month = mth.AddMonths(7), Bus = 4, Car = 5, Truck = 6 });
Accidents.Add(new StackingAreaChartModel() { Month = mth.AddMonths(8), Bus = 3, Car = 4, Truck = 5 });
Accidents.Add(new StackingAreaChartModel() { Month = mth.AddMonths(9), Bus = 4, Car = 5, Truck = 6 });
Accidents.Add(new StackingAreaChartModel() { Month = mth.AddMonths(10), Bus = 7, Car = 8, Truck = 7 });
Accidents.Add(new StackingAreaChartModel() { Month = mth.AddMonths(11), Bus = 4, Car = 5, Truck = 6 });
Accidents.Add(new StackingAreaChartModel() { Month = mth.AddMonths(12), Bus = 7, Car = 8, Truck = 7 });
Accidents.Add(new StackingAreaChartModel() { Month = mth.AddMonths(13), Bus = 4, Car = 5, Truck = 6 });
}
}Learning Resources


WinUI Stacked Area Chart User Guide
Learn more about the available options to customize WinUI Stacked Area Charts.
