Overview
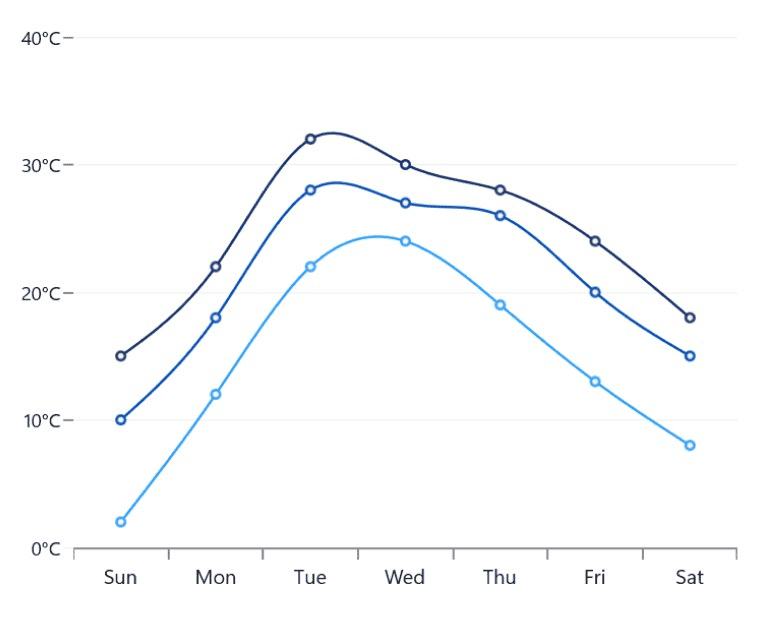
The WinUI Spline Chart is similar to a line chart, but instead of connecting data points with straight lines, the data points are connected by smooth Bezier curves.
Key Features
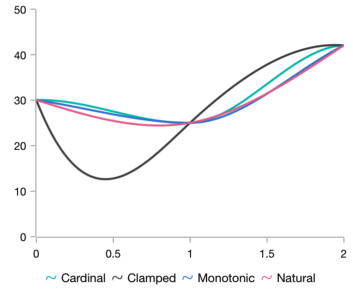
Spline types
Four different types of rendering: Natural, monotonic, cardinal, and clamped.

Vertical spline chart
Rotate the spline chart to plot data vertically and view data from a different perspective.
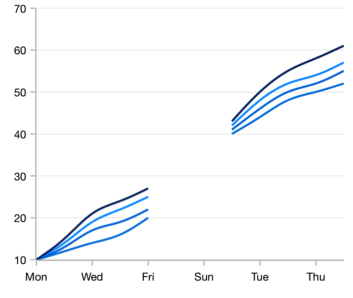
Empty/null point chart
Empty or null data points are elegantly handled in spline charts.
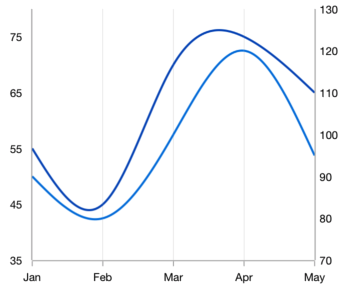
Multiple axes
Use multiple axes to plot different data sets that widely vary from one another.
Code guideline
Get started with the WinUI Spline Charts using a few simple lines of XAML and C# code example, as demonstrated below:
<Window x:Class="ChartExample.MainPage"
        xmlns="http://schemas.microsoft.com/winfx/2006/xaml/presentation"
        xmlns:x="http://schemas.microsoft.com/winfx/2006/xaml"
        xmlns:local="using:ChartExample"
        xmlns:d="http://schemas.microsoft.com/expression/blend/2008"
        xmlns:mc="http://schemas.openxmlformats.org/markup-compatibility/2006"
        xmlns:chart="using:Syncfusion.UI.Xaml.Charts"
        mc:Ignorable="d"
        Title="WinUI Spline Chart" Height="450" Width="700">

    <Grid>
        <chart:SfCartesianChart Height="300" Width="500">
            <!--Setting DataContext-->
            <chart:SfCartesianChart.DataContext>
                <local:ViewModel/>
            </chart:SfCartesianChart.DataContext>

            <!--Initialize the horizontal axis for the WinUI Chart-->
            <chart:SfCartesianChart.XAxes>
                <chart:CategoryAxis/>
            </chart:SfCartesianChart.XAxes>

            <!--Initialize the vertical axis for the WinUI Chart-->
            <chart:SfCartesianChart.YAxes>
                <chart:NumericalAxis/>
            </chart:SfCartesianChart.YAxes>

            <!--Adding Spline Series to the WinUI Chart-->
            <chart:SplineSeries
                        ItemsSource="{Binding Data}"
                        XBindingPath="Month"
                        YBindingPath="Target">
            </chart:SplineSeries>
        </chart:SfCartesianChart>
    </Grid>
</Window>
public class Model
{
public string Month { get; set; }
public double Target { get; set; }
public Model(string xValue, double yValue)
{
Month = xValue;
Target = yValue;
}
}
public class ViewModel
{
public ObservableCollection<Model> Data { get; set; }
public ViewModel()
{
Data = new ObservableCollection<Model>()
{
new Model("Jan", 50),
new Model("Feb", 70),
new Model("Mar", 65),
new Model("Apr", 57),
new Model("May", 48),
};
}
}Learning Resources


Learn more about the available options to customize WinUI Spline Charts.

Syncfusion WinUI DataViz & UI Controls
DATA VISUALIZATION
EDITORS
NOTIFICATION
MISCELLANEOUS
CONVERSATIONAL UI