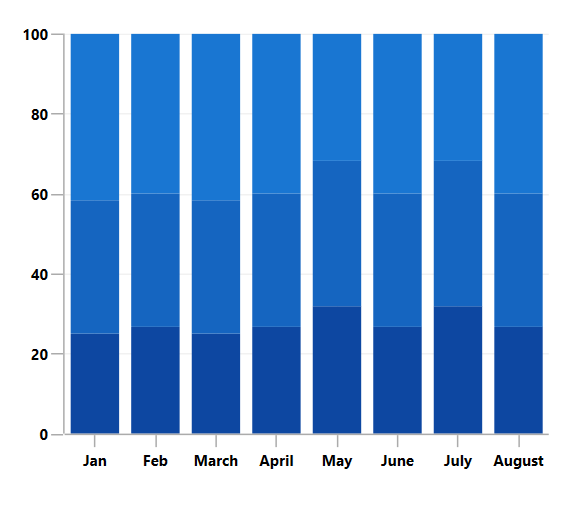
Overview
The 100% Stacked column chart displays multiple series of data as stacked columns, ensuring that the cumulative proportion of each stacked element always totals 100%. The y-axis will always render within the range, 0%–100%. Users can create beautiful, animated, real-time, and high-performance 100% stacked column charts that also support interactive features such as zooming, scrolling, trackball, tooltips, and selection.
Key features
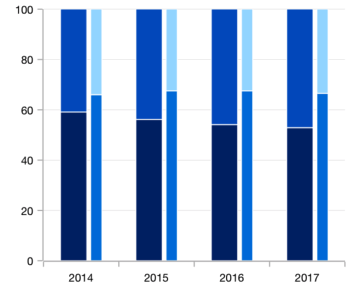
Grouped stacked chart
Group a series with another series using the group name in a chart. Group the series with different stacking names separately.
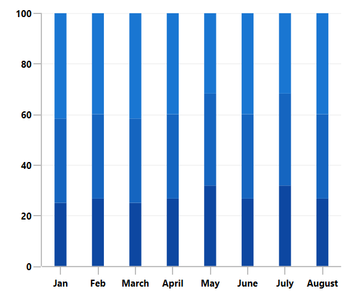
Spacing and width
The 100% stacked column chart provides an option to customize the spacing between two rectangles, which increases or decreases the width of the column.
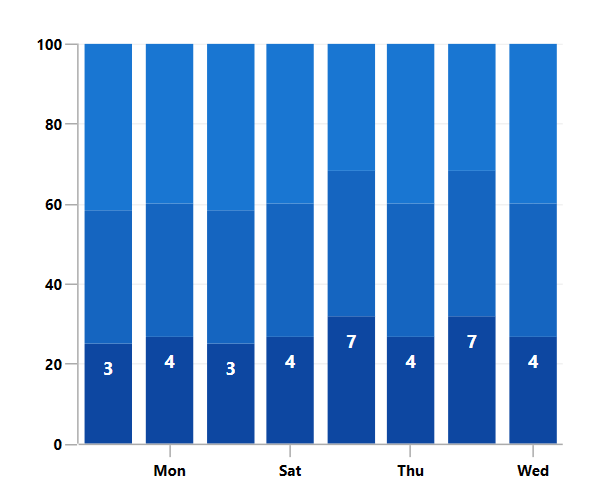
Data labels
Data labels display information about data points. The label’s foreground, border, and background can be customized. Template support helps customize the default appearance with the desired view. A data label can be rotated by a specified angle.
Code guideline
Get started with WinUI 100% Stacked column chart using a few simple lines of XAML and C# code, as demonstrated below.
<Window x:Class="ChartExample.MainPage"
        xmlns="http://schemas.microsoft.com/winfx/2006/xaml/presentation"
        xmlns:x="http://schemas.microsoft.com/winfx/2006/xaml"
        xmlns:local="using:ChartExample"
        xmlns:d="http://schemas.microsoft.com/expression/blend/2008"
        xmlns:mc="http://schemas.openxmlformats.org/markup-compatibility/2006"
        xmlns:chart="using:Syncfusion.UI.Xaml.Charts"
        mc:Ignorable="d"
        Title="WinUI 100% Stacked Column Chart" Height="450" Width="700">

    <Grid>
        <chart:SfSfCartesianChartChart Height="300" Width="500">
            <!--Setting DataContext-->
            <chart:SfCartesianChart.DataContext>
                <local:ViewModel/>
            </chart:SfCartesianChart.DataContext>

            <!--Initialize the horizontal axis for the WinUI Chart-->
            <chart:SfCartesianChart.XAxes>
                <chart:DateTimeAxis/>
            </chart:SfCartesianChart.XAxes>

            <!--Initialize the vertical axis for the WinUI Chart-->
            <chart:SfCartesianChart.YAxes>
                <chart:NumericalAxis/>
            </chart:SfCartesianChart.YAxes>

            <!--Adding 100% Stacked Column Series to the WinUI Chart-->

            <chart:StackedColumn100Series
                ItemsSource="{Binding Accidents}"
                XBindingPath="Month"
                YBindingPath="Bus">
            </chart:StackedColumn100Series>

            <chart:StackedColumn100Series
                ItemsSource="{Binding Accidents}"
                XBindingPath="Month"
                YBindingPath="Car">
            </chart:StackedColumn100Series>

            <chart:StackedColumn100Series
                ItemsSource="{Binding Accidents}"
                XBindingPath="Month"
                YBindingPath="Truck">
            </chart:StackedColumn100Series>
        </chart:SfSfCartesianChartChart>
    </Grid>
</Window>
public class StackingColumnChartModel
{
public DateTime Month { get; set; }
public double Bus { get; set; }
public double Car { get; set; }
public double Truck { get; set; }
}
public class ViewModel
{
public ObservableCollection<StackingColumnChartModel> Accidents { get; set; }
public ViewModel()
{
this.Accidents = new ObservableCollection<StackingColumnChartModel>();
DateTime mth = new DateTime(2011, 1, 1);
Accidents.Add(new StackingColumnChartModel() { Month = mth.AddMonths(6), Bus = 3, Car = 4, Truck = 5 });
Accidents.Add(new StackingColumnChartModel() { Month = mth.AddMonths(7), Bus = 4, Car = 5, Truck = 6 });
Accidents.Add(new StackingColumnChartModel() { Month = mth.AddMonths(8), Bus = 3, Car = 4, Truck = 5 });
Accidents.Add(new StackingColumnChartModel() { Month = mth.AddMonths(9), Bus = 4, Car = 5, Truck = 6 });
Accidents.Add(new StackingColumnChartModel() { Month = mth.AddMonths(10), Bus = 7, Car = 8, Truck = 7 });
Accidents.Add(new StackingColumnChartModel() { Month = mth.AddMonths(11), Bus = 4, Car = 5, Truck = 6 });
Accidents.Add(new StackingColumnChartModel() { Month = mth.AddMonths(12), Bus = 7, Car = 8, Truck = 7 });
Accidents.Add(new StackingColumnChartModel() { Month = mth.AddMonths(13), Bus = 4, Car = 5, Truck = 6 });
}
}Learning Resources

Explore the 100% WinUI Stacked Column Chart example from GitHub to learn how to render and configure charts.

100% Stacked column chart user guide
Learn more about the available options to customize WinUI 100% Stacked Column Graphs.
