Overview
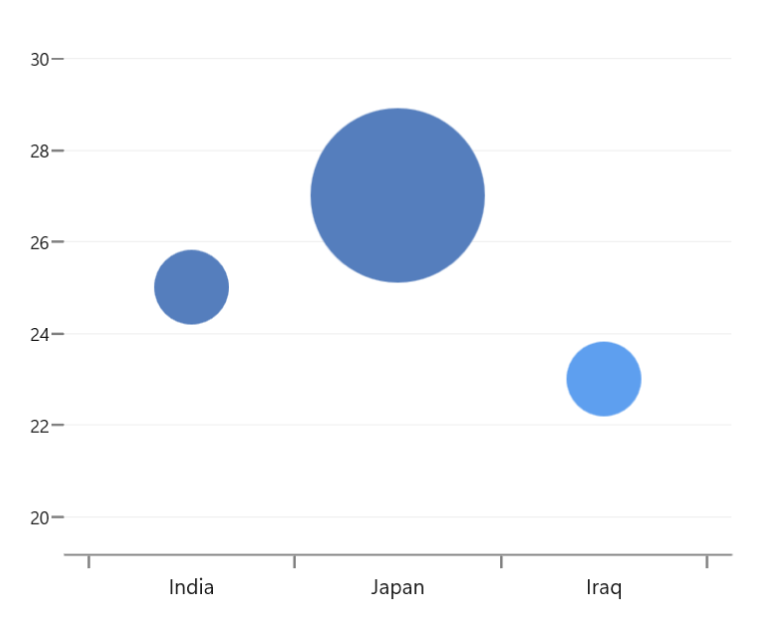
WinUI bubble charts visualize data in three dimensions similar to a scatter chart. A data point’s position is determined based on X and Y values, and the radius of its circle is determined by a size value. Users can create animated, real-time and high-performance bubble charts that also support interactive features such as zooming, scrolling, tooltip, trackball, and selection.
Key features
Radius customization
Control the minimum and maximum radius of the overall bubble series.
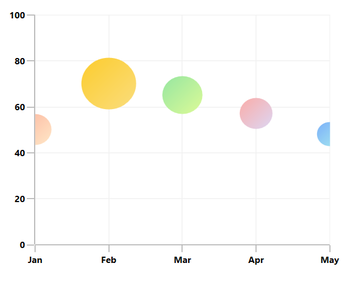
Gradient
Apply gradient colors to visualize data in different colors, improving the readability and appearance of a bubble chart.
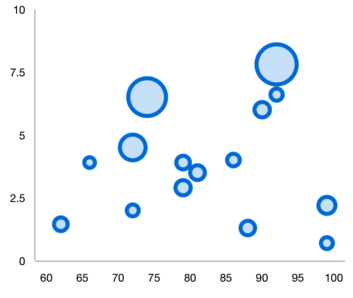
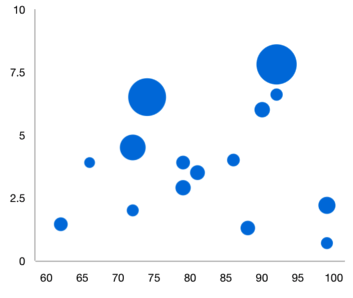
UI styling
Customize the color and border of bubble charts using built-in APIs to make it visually distinct.
Code guidelines
Get started with WinUI bubble charts using a few simple lines of XAML and C# like the example below.
<Window x:Class="ChartExample.MainPage"
        xmlns="http://schemas.microsoft.com/winfx/2006/xaml/presentation"
        xmlns:x="http://schemas.microsoft.com/winfx/2006/xaml"
        xmlns:local="using:ChartExample"
        xmlns:d="http://schemas.microsoft.com/expression/blend/2008"
        xmlns:mc="http://schemas.openxmlformats.org/markup-compatibility/2006"
        xmlns:chart="using:Syncfusion.UI.Xaml.Charts"
        mc:Ignorable="d"
        Title="WinUI Bubble Chart" Height="450" Width="700">

    <Grid>
        <chart:SfCartesianChart Height="300" Width="500">
            <!--Setting DataContext-->
            <chart:SfCartesianChart.DataContext>
                <local:ViewModel/>
            </chart:SfCartesianChart.DataContext>

            <!--Initialize the horizontal axis for the WinUI Chart-->
            <chart:SfCartesianChart.XAxes>
                <chart:CategoryAxis/>
            </chart:SfCartesianChart.XAxes>

            <!--Initialize the vertical axis for the WinUI Chart-->
            <chart:SfCartesianChart.YAxes>
                <chart:NumericalAxis/>
            </chart:SfCartesianChart.YAxes>

            <!--Adding Bubble Series to the WinUI Chart-->
            <chart:BubbleSeries ItemsSource="{Binding Data}"
                        XBindingPath="Month"
                        Size="Size"
                        YBindingPath="Target">
            </chart:BubbleSeries>
        </chart:SfCartesianChart>
    </Grid>
</Window>
public class Model
{
public string Month { get; set; }
public double Target { get; set; }
public double Size { get; set; }
public Model(string xValue, double yValue, double size)
{
Month = xValue;
Size = size;
Target = yValue;
}
}
public class ViewModel
{
public ObservableCollection<Model> Data { get; set; }
public ViewModel()
{
Data = new ObservableCollection<Model>()
{
new Model("Jan", 50, 2),
new Model("Feb", 70, 5),
new Model("Mar", 65, 3),
new Model("Apr", 57, 2),
new Model("May", 48, 1),
};
}
}