Overview
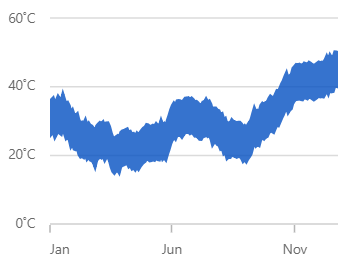
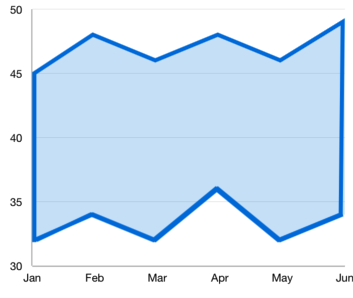
The WPF range area chart is used to display continuous data points as a set of lines that varies between high and low values over intervals of time and across different categories.
WPF Range Area Chart documentation
Key features
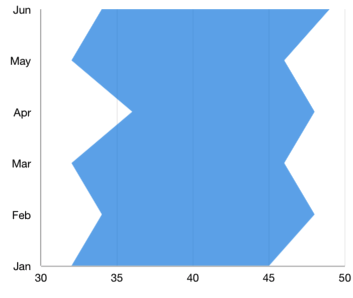
Vertical range area chart
The WPF range area chart can be transposed vertically to view data from a different perspective.
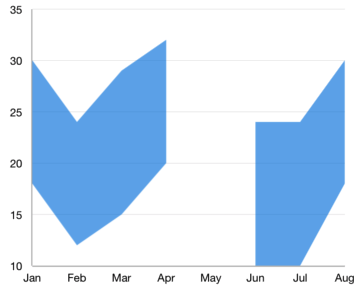
Empty and null points
The WPF range area chart handles empty or null data points elegantly.

Display markers
The WPF range area chart data points are visualized as marks with built-in symbols: crosses, squares, pluses, inverted triangles, hexagons, ellipses, vertical lines, horizontal lines, diamonds, triangles, and pentagons.
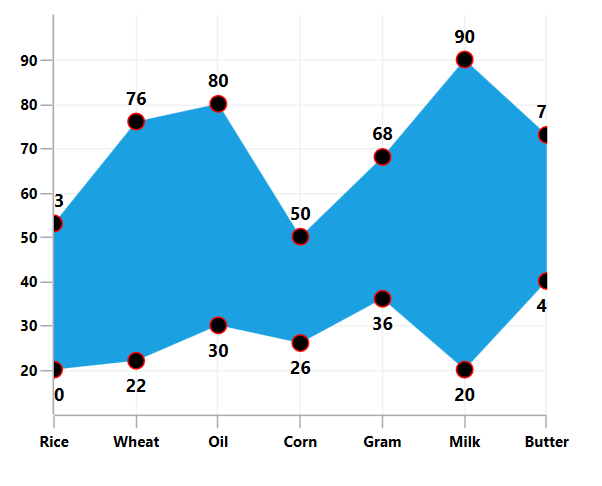
Data labels
Data labels display information about the data points.You can customize their foreground, border, and background in addition to using template support to customize the default appearance. You can also rotate a data label to a given angle.
UI styling
Customize the color and border of the range area chart using the built-in APIs to make it visually unique.
Code example
Easily get started with the WPF Range Area Chart using a few simple lines of C# code example as demonstrated below,
<Window x:Class="ChartExample.MainWindow"
        xmlns="http://schemas.microsoft.com/winfx/2006/xaml/presentation"
        xmlns:x="http://schemas.microsoft.com/winfx/2006/xaml"
        xmlns:d="http://schemas.microsoft.com/expression/blend/2008"
        xmlns:mc="http://schemas.openxmlformats.org/markup-compatibility/2006"
        xmlns:local="clr-namespace:ChartExample"
        xmlns:chart="clr-namespace:Syncfusion.UI.Xaml.Charts;assembly=Syncfusion.SfChart.WPF"
        mc:Ignorable="d"
        Title="WPF Range Area Chart" Height="450" Width="700">

    <!--Setting DataContext-->
    <Window.DataContext>
        <local:ViewModel/>
    </Window.DataContext>

    <StackPanel>
        <chart:SfChart Height="300" Width="500">
            <!--Initialize the horizontal axis for Chart-->
            <chart:SfChart.PrimaryAxis>
                <chart:CategoryAxis/>
            </chart:SfChart.PrimaryAxis>

            <!--Initialize the vertical axis for Chart-->
            <chart:SfChart.SecondaryAxis>
                <chart:NumericalAxis/>
            </chart:SfChart.SecondaryAxis>

            <!--Adding Range Area Chart to the WPF Chart-->
              <chart:RangeAreaSeries
                High="Stock"
                ItemsSource="{Binding Products}"
                Low="Price"
                XBindingPath="ProductName">
            </chart:RangeAreaSeries>
        </chart:SfChart>
    </StackPanel>
</Window>
public class RangeAreaChartModel
{
public string ProductName { get; set; }
public double Price { get; set; }
public double Stock { get; set; }
}
public class ViewModel
{
public ObservableCollection<RangeAreaChartModel> Products { get; set; }
public ViewModel()
{
this.Products = new ObservableCollection<RangeAreaChartModel>();
Products.Add(new RangeAreaChartModel() { ProductName = "Rice", Price = 20, Stock = 53 });
Products.Add(new RangeAreaChartModel() { ProductName = "Wheat", Price = 22, Stock = 76 });
Products.Add(new RangeAreaChartModel() { ProductName = "Oil", Price = 30, Stock = 80 });
Products.Add(new RangeAreaChartModel() { ProductName = "Corn", Price = 26, Stock = 50 });
Products.Add(new RangeAreaChartModel() { ProductName = "Gram", Price = 36, Stock = 68 });
Products.Add(new RangeAreaChartModel() { ProductName = "Milk", Price = 20, Stock = 90 });
Products.Add(new RangeAreaChartModel() { ProductName = "Butter", Price = 40, Stock = 73 });
}
}Learning resources


WPF Range Area Chart User Guide
Learn more about the available options to customize WPF Range Area Charts.
