Overview
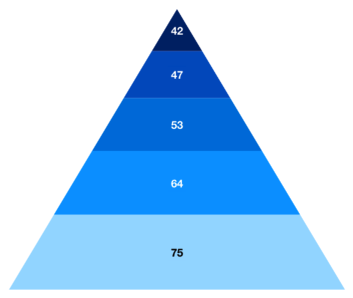
The WPF Pyramid Chart is the form of a triangle with lines dividing it into sections, each section with a different width. Depending on the Y coordinates, this width indicates a level of hierarchy among other categories. It supports data label, tooltip, and selection.
WPF Pyramid Chart documentation

Key features

Pyramid mode
Two types of display modes, linear and surface, are supported by the WPF Pyramid Chart.

Segment gap
The segments in the pyramid chart can be separated by gaps to highlight the levels in the hierarchy.

Exploding on touch
Separate a single segment in the pyramid chart to differentiate it from others.
Data labels
Data labels display information about the data points. It provides the support for customizing the foreground, border, and background in addition to template support to customize the default appearance with the desired view. You can rotate a data label by its given angle.
Code example
Easily get started with WPF Pyramid Chart using a few simple lines of XAML and C# code, as demonstrated below,
<Window x:Class="ChartExample.MainWindow"
        xmlns="http://schemas.microsoft.com/winfx/2006/xaml/presentation"
        xmlns:x="http://schemas.microsoft.com/winfx/2006/xaml"
        xmlns:d="http://schemas.microsoft.com/expression/blend/2008"
        xmlns:mc="http://schemas.openxmlformats.org/markup-compatibility/2006"
        xmlns:local="clr-namespace:ChartExample"
        xmlns:chart="clr-namespace:Syncfusion.UI.Xaml.Charts;assembly=Syncfusion.SfChart.WPF"
        mc:Ignorable="d"
        Title="WPF Pyramid Chart" Height="450" Width="700">

    <!--Setting DataContext-->
    <Window.DataContext>
        <local:ViewModel/>
    </Window.DataContext>

    <StackPanel>
        <chart:SfChart Height="300" Width="500">
            <!--Initialize the horizontal axis for the WPF Chart-->
            <chart:SfChart.PrimaryAxis>
                <chart:CategoryAxis />
            </chart:SfChart.PrimaryAxis>

            <!--Initialize the vertical axis for the WPF Chart-->
            <chart:SfChart.SecondaryAxis>
                <chart:NumericalAxis />
            </chart:SfChart.SecondaryAxis>

            <!--Adding Pyramid Series to the WPF Chart-->
            <chart:PyramidSeries
                    ItemsSource="{Binding Data}"
                    XBindingPath="Month"
                    YBindingPath="Target">
            </chart:PyramidSeries>
        </chart:SfChart>
    </StackPanel>
</Window>
public class Model
{
public string Month { get; set; }
public double Target { get; set; }
public Model(string xValue, double yValue)
{
Month = xValue;
Target = yValue;
}
}
public class ViewModel
{
public ObservableCollection<Model> Data { get; set; }
public ViewModel()
{
Data = new ObservableCollection<Model>()
{
new Model("Jan", 50),
new Model("Feb", 70),
new Model("Mar", 65),
new Model("Apr", 57),
new Model("May", 48),
};
}
}Learning resources

Explore the WPF Pyramid Chart example from GitHub to learn how to render and configure charts.

Learn more about the available options to customize WPF Pyramid Charts.
