We use cookies to give you the best experience on our website. If you continue to browse, then you agree to our privacy policy and cookie policy.


The JavaScript Bullet Chart is used to visually compare measures, similar to the commonly used bar chart. A bullet chart displays one or more measures and compares them with a target value. You can also display the measures in a range of performance such as poor, satisfactory, and good.
Position the bullet chart in either vertical or horizontal orientation. This is helpful when viewing the bullet chart on mobile devices.
Render the JavaScript Bullet Chart control in either LTR or RTL directions.
Actual bar that runs along the bullet chart denote the current value and target bar runs perpendicular to the actual bar.
Render multiple measure bars as well as multiple target bars to allow comparison of several measures at once.

A range in a bullet chart helps measure the performance of data against a qualitative state by observing the distance between each range. Each color of the range represents a quality such as good, bad, and acceptable.

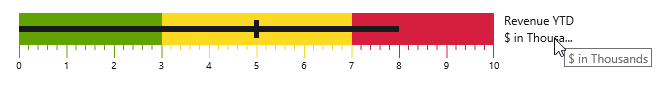
Display a scale with two types of ticks. Major ticks are the primary scale indicators, and minor ticks are the secondary scale indicators that fall between the major ticks. You can apply color ranges to both minor and major ticks.
The labels in the chart display numeric values on the major ticks in the range of the scale. You can apply the range’s color to the labels that are associated with it.

Display details about measures through a tooltip that appears when hovering the mouse over the measures.

Titles and subtitles display additional information about the chart.

Place the text elements, such as title and subtitle text, at any side of the scale. The text element will trim if it overlaps with the scale.
Easily get started with JavaScript Bullet Chart using a few simple lines of HTML and JS code example as demonstrated below. Also explore our JavaScript Bullet Chart Example that shows you how to render and configure the chart.
<!DOCTYPE html>
<html>
<head></head>
<body>
    <div id="container">
     <div id="element"></div>
    </div>
</body>
</html>
import { BulletChart } from '@syncfusion/ej2-charts';
let bulletChart: BulletChart = new BulletChart({
dataSource: [{ value: 100, target: 80 },
{ value: 200, target: 180 },
{ value: 300, target: 280 },
{ value: 400, target: 380 },
{ value: 500, target: 480 }],
valueName: 'value',
targetName: 'target',
height: '300',
minimum: 0, maximum: 300, interval: 50,
});
bulletChart.appendTo('#element');The Bullet Chart component is also available in Blazor, React, Angular, and Vue frameworks. Check out the different Bullet Chart platforms from the links below,
You can find our JavaScript Bullet Chart demo here.
No, this is a commercial product and requires a paid license. However, a free community license is also available for companies and individuals whose organizations have less than $1 million USD in annual gross revenue, 5 or fewer developers, and 10 or fewer total employees.
A good place to start would be our comprehensive getting started documentation.


 Documentation
Greatness—it’s one thing to say you have it, but it means more when others recognize it. Syncfusion is proud to hold the following industry awards.