We use cookies to give you the best experience on our website. If you continue to browse, then you agree to our privacy policy and cookie policy.


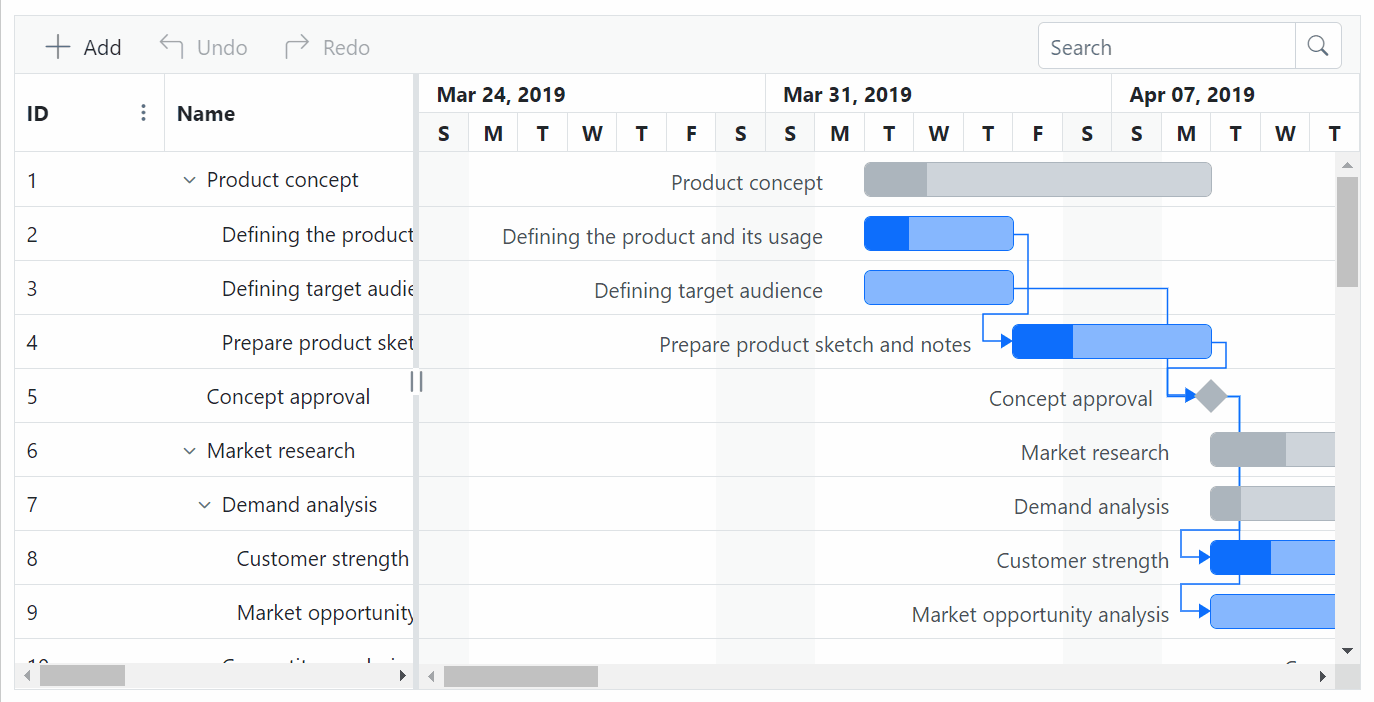
The JavaScript Gantt Chart is a project planning and management tool that provides a Microsoft Project-like interface to display and manage hierarchical tasks with timeline details. Its intuitive user interface lets you visually manage tasks, resources, and task relationships in a project.

Virtual scrolling in the JavaScript Gantt Chart allows you to load large amounts of data without performance degradation.

Bind data seamlessly with various local and remote data sources such as JSON, OData, WCF, and RESTful web services with the help of a data manager.

Gantt Chart has a highly responsive layout and an optimized design for desktops, touchscreens, and phones. It works well on all mobile phones that use iOS, Android, or Windows OS.

The Gantt Chart for JavaScript provides fluid animation to present data with smooth transitions.

Template support is used to customize taskbars and grid columns. Customize the timeline header for a better view of the data.

Increase or decrease the width of timeline cells and change the timeline units dynamically with zooming. This lets you clearly view tasks in a project, from minute to decade.

Cutting-edge design with several built-in themes, such as Fluent, Tailwind CSS, Bootstrap, Material, and Fabric. Utilize the online Theme Studio tool to customize themes of Gantt Chart easily.

Enable users from different locales to use the control by formatting dates, currency, and numbering to suit preferences.
Easily get started with the JavaScript Gantt Chart using a few simple lines of HTML and TS code example as demonstrated below. Also explore our JavaScript Gantt Chart Example that shows you how to render and configure a Gantt Chart in JavaScript.
<div class="control-section">
    <div class="content-wrapper">
        <div id="DefaultFunctionalities">
        </div>
    </div>
</div>
import { loadCultureFiles } from '../common/culture-loader';
import { Gantt, Selection } from '@syncfusion/ej2-gantt';
import { projectNewData } from './data-source';
/**
* Default Gantt sample
*/
Gantt.Inject(Selection);
loadCultureFiles();
let gantt: Gantt = new Gantt(
{
dataSource: projectNewData,
height: '450px',
taskFields: {
id: 'TaskID',
name: 'TaskName',
startDate: 'StartDate',
endDate: 'EndDate',
duration: 'Duration',
progress: 'Progress',
dependency: 'Predecessor',
child: 'subtasks'
},
labelSettings: {
leftLabel: 'TaskName'
},
projectStartDate: new Date('03/24/2019'),
projectEndDate: new Date('07/06/2019')
});
gantt.appendTo('#DefaultFunctionalities');The JavaScript Gantt Chart supports different configurable timeline views such as hour, day, week, month, and year.

Users can easily plan and schedule tasks in both auto and manual mode to track their projects. Create relationships between different tasks in project management. When a project is complex and contains many tasks that depend on the completion of others, task dependencies enable you to decide when a task can be started or finished using finish-to-start, start-to-finish, start-to-start, and finish-to-finish task link types.
The JavaScript Gantt Chart offers support for the critical path, representing a series of tasks that directly influence the calculated finish date of a project. If any task within the critical path is delayed, it leads to a delay in the timeline. This feature is particularly useful for managing projects with fixed deadlines, allowing users to identify and prioritize tasks crucial for timely delivery.


The split task feature allows users to split a task or interrupt the work during planned or unforeseen circumstances. It makes the view dynamic and interactive, improving the visualization of the project taskbar. Multiple segments can be split and merged within a taskbar.
Visualize the list of tasks assigned to each resource in a hierarchical manner. Multiple tasks assigned to each resource can be visualized in a row when the records are in a collapsed state.

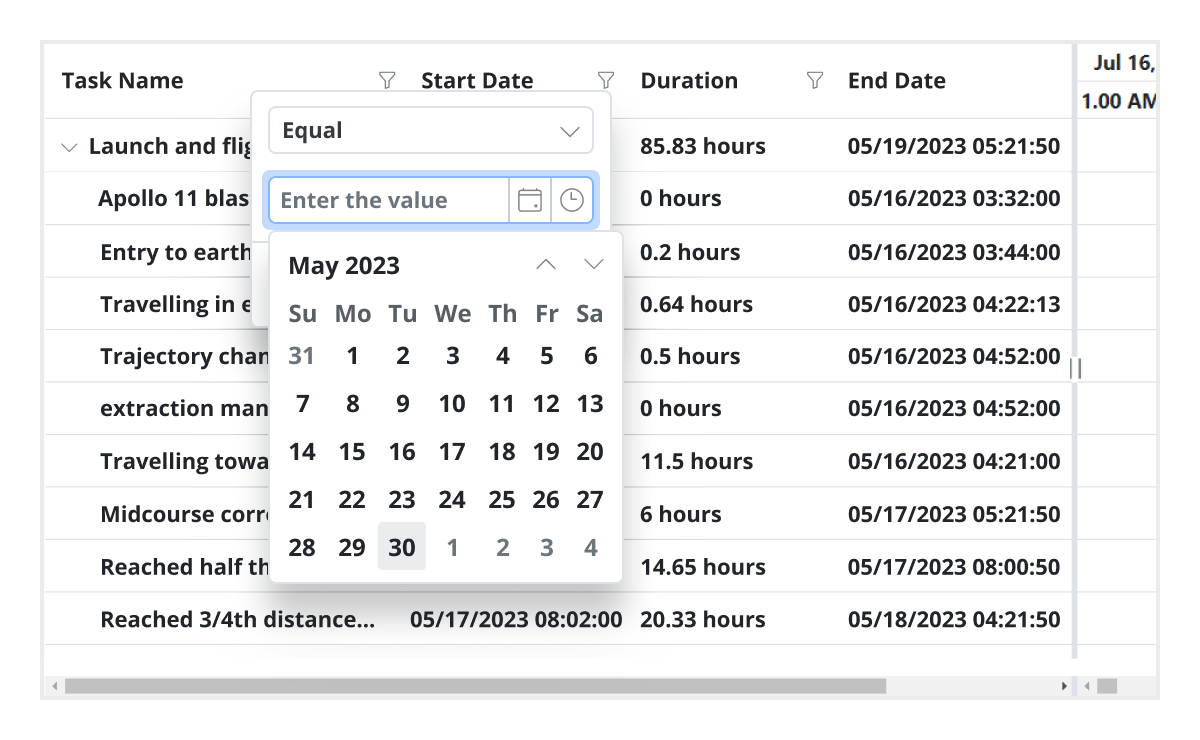
Data across all columns can be filtered using the filter option in each column and search option in the toolbar. It supports two filter types, Excel-like filter and menu filter. The Gantt Chart filter allows users to choose appropriate filter types, define their own custom filtering logic, and customize the filtering UI based on their application needs. Filtering with related parent or child records can be defined.
The Gantt Chart provides full support to create, read, update, and delete (CRUD) operations. In addition to built-in editor controls to edit a particular column value, using template support users can create custom editor controls that suit their application needs. Users can also edit the tasks fields directly in their respective cells using a dialog or interactively using taskbars.
The Undo feature enables users to revert the most recent action performed in the Gantt Chart. Whether it is modifying tasks, adjusting dependencies, or any other action within the interface, the undo feature provides users with the ability to backtrack the changes as needed. Additionally, the redo feature complements the undo functionality by allowing users to reapply an action that was previously undone.
Virtual scroll in JS Gantt Chart allows you to load large amounts of data without performance degradation. In row virtualization mode, all tasks are fetched initially from the datasource and rendered in the DOM within a compact viewport area.


Focus on the tasks that are not visible but scheduled later along the timeline by selecting their rows in the grid section.
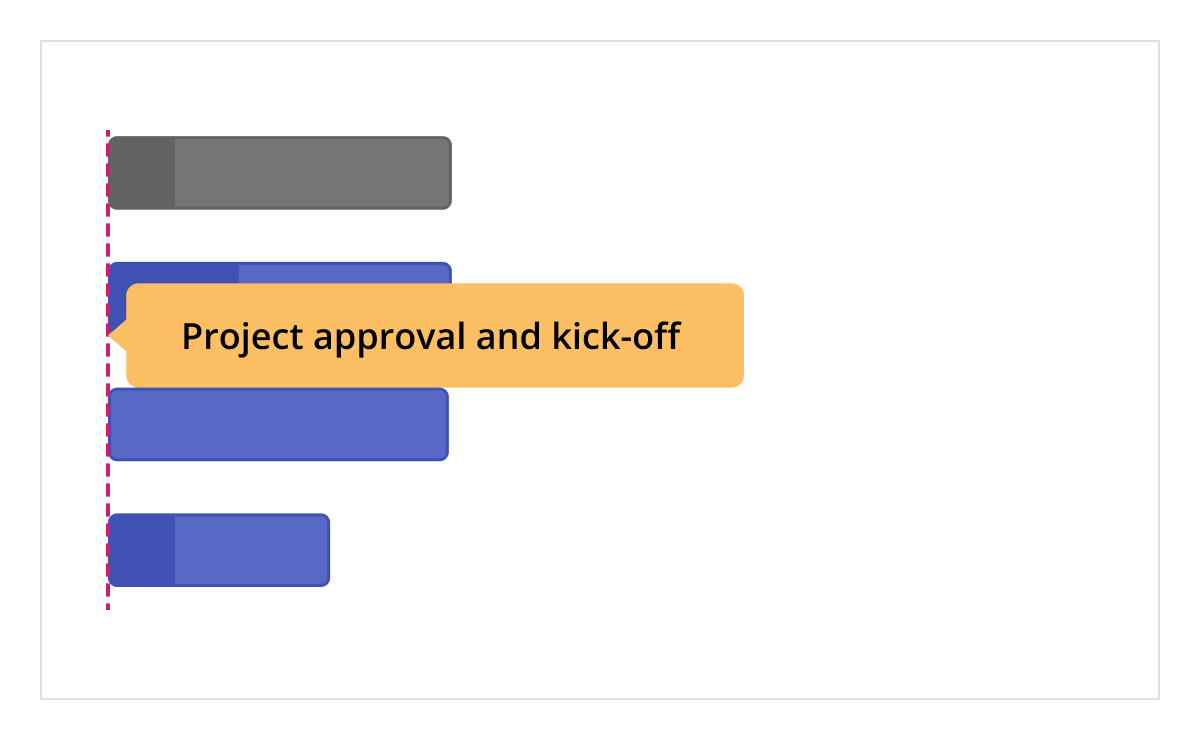
Highlight important days or events in a project using event markers.

Compare the current task’s progress with the planned timeline using baselines.
Allocate multiple resources like staff, equipment, and materials to each task using JavaScript Gantt Chart component.

Display events for a specific task that can be placed on the timeline on any given date.

The tooltip displays task information while the mouse hovers over the task and editing actions for the taskbar and connector lines.

Row height is a major factor when displaying records in the view port and it can be customized effortlessly based on the application’s UI requirement. The height of child taskbars and parent taskbars can be customized using the taskbarHeight property.

The context menu improves user action with pop-up menu. It appears when a cell or header is right clicked. In addition to built-in default menu items, it allows you to add custom context menu items.

Easily export the Gantt Chart component in file formats such as Excel or CSV.

The HTML5 JavaScript Gantt Chart ensures that every cell is keyboard accessible. Major features like sorting, selection, and editing can be performed using keyboard commands alone; no mouse interaction required. This helps in creating highly accessible applications using this component.

The JavaScript Gantt Chart has complete WAI-ARIA accessibility support. The Gantt Chart UI includes high-contrast visual elements, helping visually impaired people have the best viewing experience. Also, valid UI descriptions are easily accessible through assistive technologies such as screen readers.
The JavaScript Gantt Chart has a highly responsive layout and a fine touch-interactions support for desktops, touch screens, and smart phones.

User-friendly touch gestures and an interactive UI design help produce the best user experience. All Gantt Chart features work on touch devices with zero configuration.

The responsive feature allows the JavaScript Gantt Chart layout to be viewed on various devices. It is also possible to hide specific columns for particular screen sizes using column-based media query support.
The Gantt Chart component is also available in Blazor, React, Angular, and Vue frameworks. Check out the different Gantt Chart platforms from the links below,
The JavaScript Gantt Chart works well with all modern web browsers such as Chrome, Firefox, Microsoft Edge, Safari, and Opera.

The JavaScript Gantt Chart with rich set of features offers the following:
We do not sell the JavaScript Gantt Chart separately. It is only available for purchase as part of the Syncfusion team license. This contains over 1,800 components and frameworks, including the JavaScript Gantt Chart. The price of the team license starts at $395 per month for 5 developers, and includes support and updates until the subscription expires. In addition, we might offer discounts based on currently active promotions. Please contact our product specialists today to see if you qualify for any additional discounts.
You can find our JavaScript Gantt Chart demo, which demonstrates how to render and configure the Gantt Chart.
No, our 1,800+ components and frameworks for web, mobile, and desktop, including our JavaScript Gantt Chart, are not sold individually. They are only available as part of a team license. However, we have competitively priced the product, so it only costs a little bit more than what some other vendors charge for their Gantt Chart control alone. We have also found that, in our experience, our customers usually start off using one of our products and then expand to several products quickly, so we felt it was best to offer all 1,800+ components and frameworks for a subscription fee that starts at $395 per month for a team of 5 developers. Additionally, we might be able to offer discounts based on currently active promotions. Please contact our product specialists today to see if you qualify for any additional discounts.
No, this is a commercial product and requires a paid license. However, a free community license is also available for companies and individuals whose organizations have less than $1 million USD in annual gross revenue, 5 or fewer developers, and 10 or fewer total employees.
A good place to start would be our comprehensive getting started documentation.


 Documentation
Greatness—it’s one thing to say you have it, but it means more when others recognize it. Syncfusion is proud to hold the following industry awards.
The JavaScript Gantt Chart tutorial videos and blog posts will guide you in building your first app with this JavaScript controls. They provide problem-solving strategies, describe features and functionalities, announce new feature releases, explain best practices, and showcase example scenarios. Explore our latest posts on our blog and tutorial video channels for JavaScript Gantt Chart updates.
BLOG
Using JavaScript Gantt Chart in SharePoint Web Parts for Effective Project Management: Part 1
SEPTEMBER 29, 2023