Overview
Each task in the data source is validated based on the child tasks with some factors like working time, holidays, weekends, and predecessors, and then rendered under the Gantt chart timeline within its time period as a bar chart. The start date, end date, progress, and duration of a task are depicted as horizontal rectangular bars.
Baseline
Baseline visualizes the difference between the original scheduled date and the current scheduled date of a task in a project. Each task has two taskbars rendered on the same row for comparison of dates to help understand the overall progression of the project.

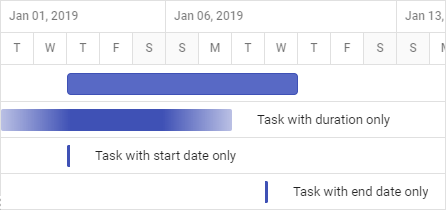
Unscheduled tasks
The JavaScript Gantt Chart with its rich UI provides built-in support for unscheduled tasks. These are tasks that are not scheduled with proper dates or duration at the start of the project, but which can be scheduled properly at any time during project implementation based on factors such as resource availability and dependent tasks.
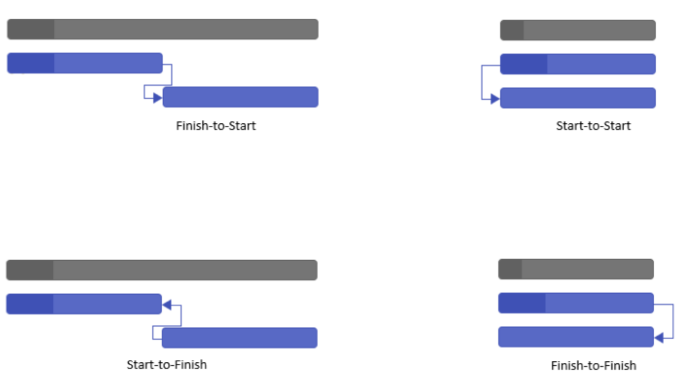
Dependency tasks
JavaScript Gantt chart shows the dependency relationship between tasks in the project. These tasks have an effect on one another and illustrate when a task should begin or end in relation to other tasks.

Flexible working hours
The default working hours are set from 08:00 to 17:00. However, this can be customized for each day of the week, allowing for flexible scheduling that aligns with the specific project requirements.
Our Customers Love Us


See Real Success Stories
Developers around the world trust Syncfusion’s Essential Studio to simplify complex projects and speed up delivery. With a vast library of UI controls, powerful SDKs, and reliable support, Essential Studio helps teams build enterprise-ready applications with confidence.
Read Our Customer StoriesIndustry
Software development
75% Cost reduction
50% Faster development
Industry
Utilities (oil and gas)
450+ hours saved
Streamlined processes and hours of development effort saved.
Advanced, flexible features
Empowered users through robust and versatile functionality.
Industry
Software and technology
1000+ of hours saved
Accelerated development with enterprise-ready UI components.
Efficient file management
Streamlined workflows with document libraries without building them from scratch.
Industry
Software and technology
2 Years of delay avoided
Two years of delays prevented with proactive planning.
On-time delivery
Projects delivered on schedule using trusted controls.
Industry
IT services and IT consulting
Improved performance
Large datasets handled with easy customization and quick debugging.
Highly customizable
Plug-and-play controls with quick template integration.
Industry
Professional services
Instant access
Quick availability of features and resources.
Reduced dependencies
Fewer dependencies for faster development.