Overview
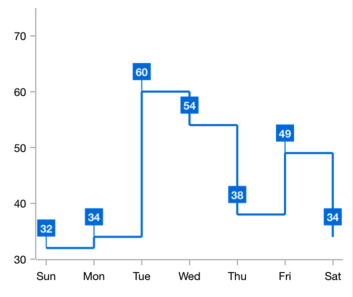
The WinUI Step line chart (a.k.a WinUI Stepped chart or WinUI Stepped line chart) is similar to the line chart, but it does not use the shortest distance to connect two data points using straight lines. Instead, the step line chart uses vertical and horizontal lines to connect data points in a series forming a step-like progression. The step line chart supports numeric, categoric, date-time, and logarithmic axes. It also supports zooming, scrolling, trackball, tooltips, and selection.
Key features
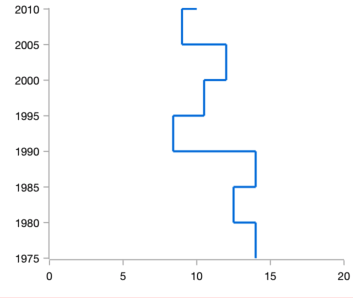
Vertical chart
Rotate the step line chart to plot data vertically and view data from a different perspective.
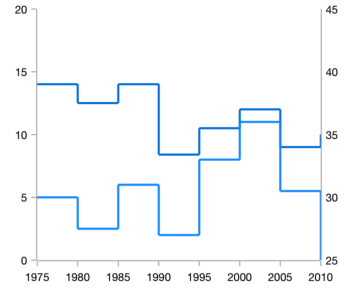
Multiple axes
Use multiple axes to plot different data sets along two or more axes that have different data points and values.
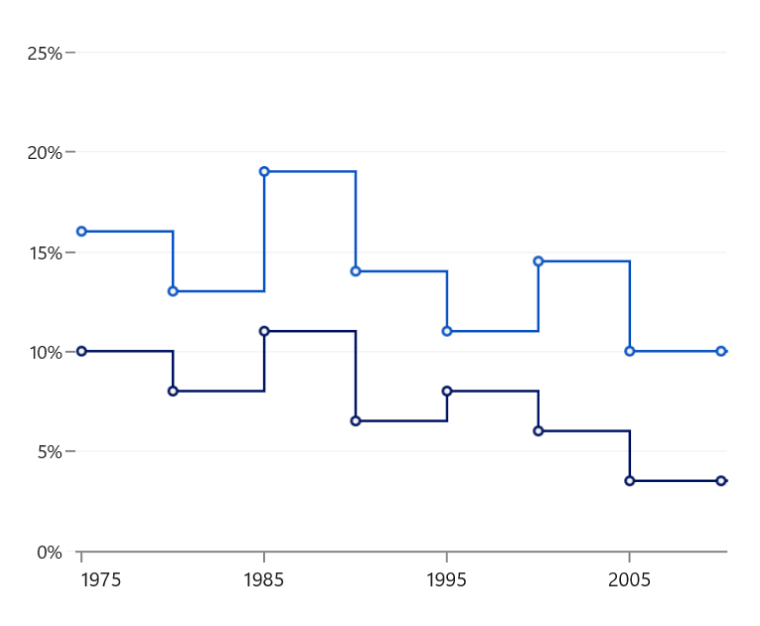
Empty or null point chart
The step line chart handles empty or null data points elegantly.
Data labels
Data labels display information about data points. Users can customize their foreground, border, and background colors. Use Template support to customize the default appearance with the desired view. Labels can rotated by setting a specific angle.
Code guideline
Get started with the WinUI Step line chart using a few simple lines of XAML and C# code, as demonstrated below.
<Window x:Class="ChartExample.MainPage"
        xmlns="http://schemas.microsoft.com/winfx/2006/xaml/presentation"
        xmlns:x="http://schemas.microsoft.com/winfx/2006/xaml"
        xmlns:local="using:ChartExample"
        xmlns:d="http://schemas.microsoft.com/expression/blend/2008"
        xmlns:mc="http://schemas.openxmlformats.org/markup-compatibility/2006"
        xmlns:chart="using:Syncfusion.UI.Xaml.Charts"
        mc:Ignorable="d"
        Title="WinUI Step Line Chart" Height="450" Width="700">

    <Grid>
        <chart:SfCartesianChart Height="300" Width="500">
            <!--Setting DataContext-->
            <chart:SfCartesianChart.DataContext>
                <local:ViewModel/>
            </chart:SfCartesianChart.DataContext>

            <!--Initialize the horizontal axis for the WinUI Chart-->
            <chart:SfCartesianChart.XAxes>
                <chart:CategoryAxis/>
            </chart:SfCartesianChart.XAxes>

            <!--Initialize the vertical axis for the WinUI Chart-->
            <chart:SfCartesianChart.YAxes>
                <chart:NumericalAxis/>
            </chart:SfCartesianChart.YAxes>

            <!--Adding Step Line Series to the WinUI Chart-->
             <chart:StepLineSeries ItemsSource="{Binding Data}"
                        XBindingPath="Month"
                        YBindingPath="Target">
                </chart:StepLineSeries>
        </chart:SfCartesianChart>
    </Grid>
</Window>
public class Model
{
public string Month { get; set; }
public double Target { get; set; }
public Model(string xValue, double yValue)
{
Month = xValue;
Target = yValue;
}
}
public class ViewModel
{
public ObservableCollection<Model> Data { get; set; }
public ViewModel()
{
Data = new ObservableCollection<Model>()
{
new Model("Jan", 50),
new Model("Feb", 70),
new Model("Mar", 65),
new Model("Apr", 57),
new Model("May", 48),
};
}
}Learning resources

Explore the WinUI Step Line chart example from GitHub to learn how to render and configure charts.

WinUI Step line chart user guide
Learn more about the available options to customize WinUI Step line charts.
