Overview
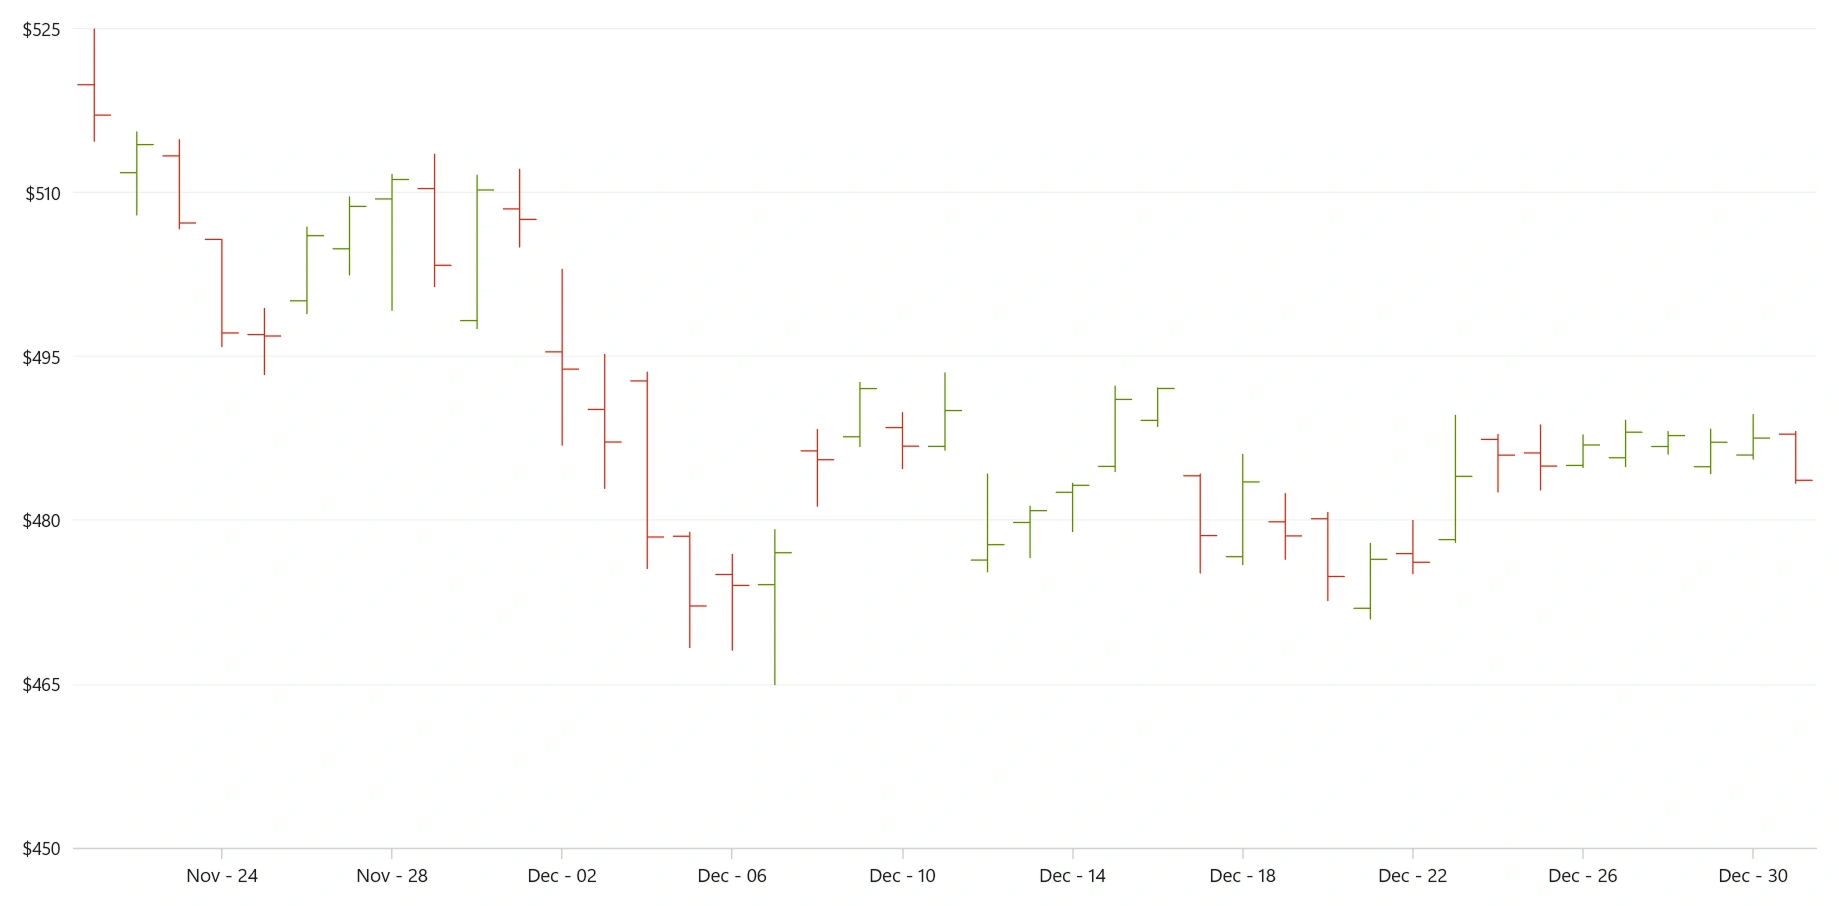
The WinUI OHLC (open-high-low-close) chart displays stock price movements using vertical and horizontal lines. The vertical line represents the high and low values, while the horizontal ticks on the left and right indicate the opening and closing prices. OHLC charts support real-time updates and interactive features such as zooming, panning, trackball, tooltips, and selection.
Key features
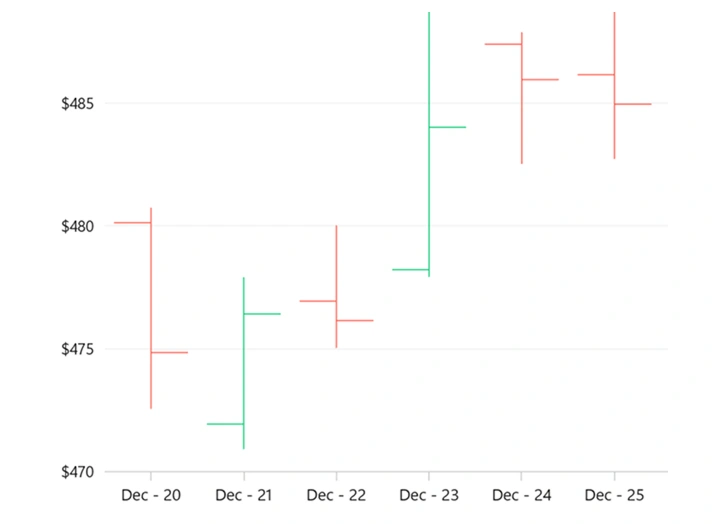
Bull and bear
Personalize your OHLC chart by applying custom bullish and bearish brushes.
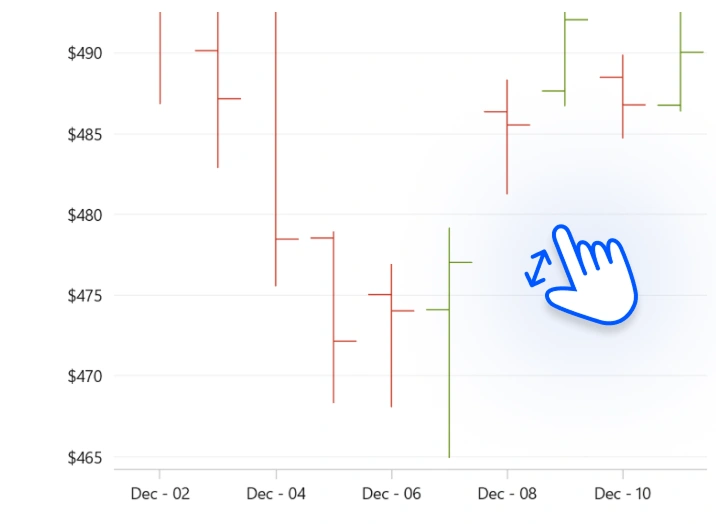
Zooming and scrolling
Zoom and pan within the OHLC chart to focus on particular areas of financial data.
Code guidelines
Get started with WinUI OHLC charts by using just a few simple lines of XAML and C# code, as shown in the following example.
<Window x:Class="ChartExample.MainWindow"
        xmlns="http://schemas.microsoft.com/winfx/2006/xaml/presentation"
        xmlns:x="http://schemas.microsoft.com/winfx/2006/xaml"
        xmlns:local="using:ChartExample"
        xmlns:d="http://schemas.microsoft.com/expression/blend/2008"
        xmlns:mc="http://schemas.openxmlformats.org/markup-compatibility/2006"
        xmlns:chart="using:Syncfusion.UI.Xaml.Charts"
        mc:Ignorable="d"
        Title="WinUI OHLC Chart">

    <Grid>
        <chart:SfCartesianChart>
            <!--Setting DataContext-->
            <chart:SfCartesianChart.DataContext>
                <local:ViewModel/>
            </chart:SfCartesianChart.DataContext>

            <!--Initialize the horizontal axis for the WinUI chart-->
            <chart:SfCartesianChart.XAxes>
                <chart:CategoryAxis/>
            </chart:SfCartesianChart.XAxes>

            <!--Initialize the vertical axis for the WinUI chart-->
            <chart:SfCartesianChart.YAxes>
                <chart:NumericalAxis/>
            </chart:SfCartesianChart.YAxes>

            <!--Adding OHLC Series to the WinUI chart-->
            <chart:HiLoOpenCloseSeries ItemsSource="{Binding Data}"
                                       XBindingPath="Month"
                                       High="High" Low="Low"
                                       Open="Open" Close="Close">
            </chart:HiLoOpenCloseSeries>
        </chart:SfCartesianChart>
    </Grid>
</Window>
public class DataModel
{
public string Month { get; set; }
public double High { get; set; }
public double Low { get; set; }
public double Open { get; set; }
public double Close { get; set; }
public DataModel(string xValue, double high, double low, double open, double close)
{
Month = xValue;
High = high;
Low = low;
Open = open;
Close = close;
}
}
public class ViewModel
{
public ObservableCollection<DataModel> Data { get; set; }
public ViewModel()
{
Data = new ObservableCollection<DataModel>()
{
new DataModel("Jan",97.33,93.69,94.02,96.47 ),
new DataModel("Feb",106.0237,98.0237,104.91,102.31),
new DataModel("Mar",107.65,104.89,105.93,105.67),
new DataModel("Apr",112.39,108.66,108.97,109.85),
new DataModel("May",100.73,95.67,95.87,100.35),
};
}
}Learning resources


Syncfusion WinUI DataViz & UI Controls
DATA VISUALIZATION
EDITORS
NOTIFICATION
MISCELLANEOUS
CONVERSATIONAL UI