Overview
The WinUI Circular charts offers interactive features such as tooltip and selection. You can configure these features using developer-friendly APIs. They provide a smooth user experience.
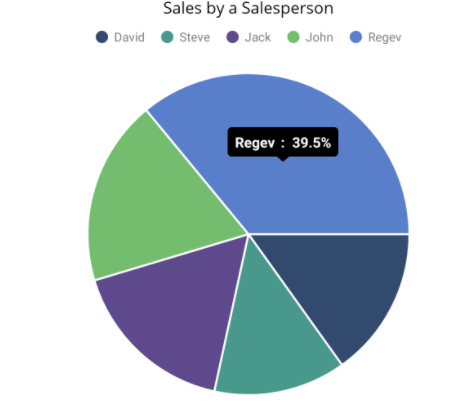
Tooltip
Displays a pop-up with additional information when the mouse pointer touches a data point.
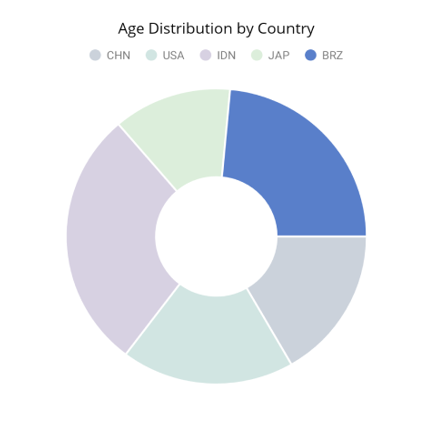
Selection
Interactively select and highlight a data point. This is used to navigate to another page of information about a selected data point or update other components on the same page based on the selected data point in the chart.
Syncfusion WinUI DataViz & UI Controls
DATA VISUALIZATION
EDITORS
NOTIFICATION
MISCELLANEOUS
CONVERSATIONAL UI