Overview
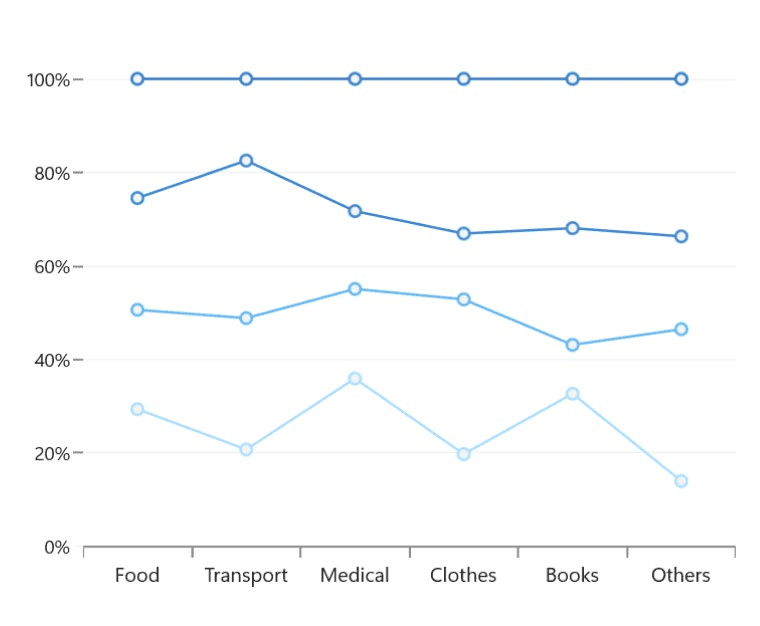
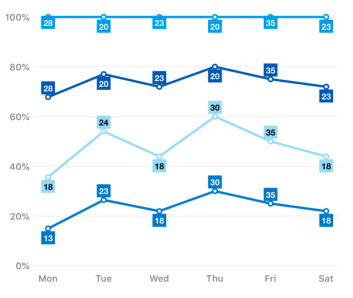
The WinUI 100% Stacked Line Chart displays multiple series of data as stacked lines, ensuring that the cumulative proportion of stacked elements always totals 100%. The y-axis will always render within the range, 0%–100%. Users can create beautiful, animated, real-time, high-performance, 100% stacked line charts that also support interactive features such as zooming, scrolling, trackballs, and tooltips.
Key features
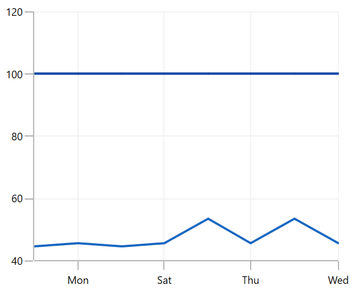
Grouped stacked chart
The 100% stacked line chart supports grouping series independently by assigning different group names.
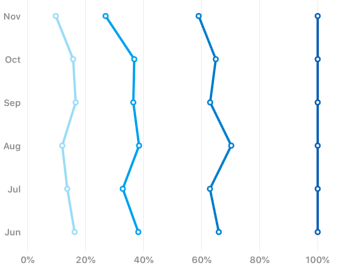
Vertical chart
Rotate the 100% stacked line chart to plot data vertically and view data from a different perspective.
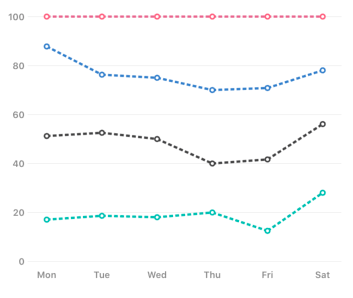
UI styling
Customize the color and dash patterns of the 100% stacked line chart using built-in APIs to create a visually distinctive appearance.
Data labels
Data labels display information about data points. Customize the label’s foreground, border, and background. Template support to customize the default appearance with the desired view. Rotate a data label by a specified angle.
Code guideline
Get started with WinUI 100% Stacked line chart using a few simple lines of XAML and C# code, as demonstrated below.
<Window x:Class="ChartExample.MainPage"
        xmlns="http://schemas.microsoft.com/winfx/2006/xaml/presentation"
        xmlns:x="http://schemas.microsoft.com/winfx/2006/xaml"
        xmlns:local="using:ChartExample"
        xmlns:d="http://schemas.microsoft.com/expression/blend/2008"
        xmlns:mc="http://schemas.openxmlformats.org/markup-compatibility/2006"
        xmlns:chart="using:Syncfusion.UI.Xaml.Charts"
        mc:Ignorable="d"
        Title="WinUI 100% Stacked Line Chart" Height="450" Width="700">

    <Grid>
        <chart:SfCartesianChart Height="300" Width="500">
            <!--Setting DataContext-->
            <chart:SfCartesianChart.DataContext>
                <local:ViewModel/>
            </chart:SfCartesianChart.DataContext>

            <!--Initialize the horizontal axis for the WinUI Chart-->
            <chart:SfCartesianChart.XAxes>
                <chart:DateTimeAxis/>
            </chart:SfCartesianChart.XAxes>

            <!--Initialize the vertical axis for the WinUI Chart-->
            <chart:SfCartesianChart.YAxes>
                <chart:NumericalAxis/>
            </chart:SfCartesianChart.YAxes>

            <!--Adding 100% Stacked Line Series to the WinUI Chart-->

            <chart:StackedLine100Series
                ItemsSource="{Binding Accidents}"
                XBindingPath="Month"
                YBindingPath="Bus">
            </chart:StackedLine100Series>

            <chart:StackedLine100Series
                ItemsSource="{Binding Accidents}"
                XBindingPath="Month"
                YBindingPath="Car">
            </chart:StackedLine100Series>

            <chart:StackedLine100Series
                ItemsSource="{Binding Accidents}"
                XBindingPath="Month"
                YBindingPath="Truck">
            </chart:StackedLine100Series>
        </chart:SfCartesianChart>
    </Grid>
</Window>
public class StackingLineChartModel
{
public DateTime Month { get; set; }
public double Bus { get; set; }
public double Car { get; set; }
public double Truck { get; set; }
}
public class ViewModel
{
public ObservableCollection<StackingLineChartModel> Accidents { get; set; }
public ViewModel()
{
this.Accidents = new ObservableCollection<StackingLineChartModel>();
DateTime mth = new DateTime(2011, 1, 1);
Accidents.Add(new StackingLineChartModel() { Month = mth.AddMonths(6), Bus = 3, Car = 4, Truck = 5 });
Accidents.Add(new StackingLineChartModel() { Month = mth.AddMonths(7), Bus = 4, Car = 5, Truck = 6 });
Accidents.Add(new StackingLineChartModel() { Month = mth.AddMonths(8), Bus = 3, Car = 4, Truck = 5 });
Accidents.Add(new StackingLineChartModel() { Month = mth.AddMonths(9), Bus = 4, Car = 5, Truck = 6 });
Accidents.Add(new StackingLineChartModel() { Month = mth.AddMonths(10), Bus = 7, Car = 8, Truck = 7 });
Accidents.Add(new StackingLineChartModel() { Month = mth.AddMonths(11), Bus = 4, Car = 5, Truck = 6 });
Accidents.Add(new StackingLineChartModel() { Month = mth.AddMonths(12), Bus = 7, Car = 8, Truck = 7 });
Accidents.Add(new StackingLineChartModel() { Month = mth.AddMonths(13), Bus = 4, Car = 5, Truck = 6 });
}
}Learning resources

Explore the WinUI 100% Stacked line chart example from GitHub to learn how to render and configure charts.

WinUI 100% Stacked line chart user guide
Learn more about the available options to customize WinUI 100% Stacked Line Charts.
