Overview
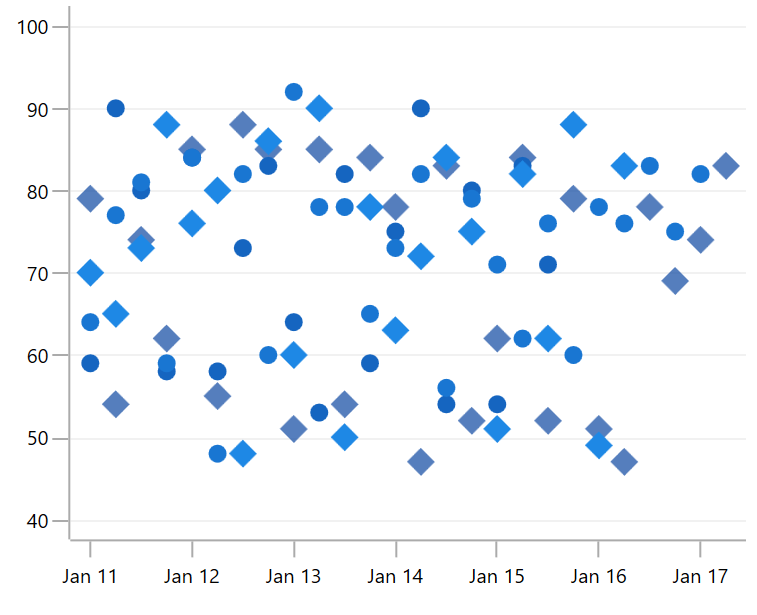
The WinUI Scatter Chart plots data with two numeric parameters. Plot multiple scatter series in a single chart to compare different data sets. The scatter chart uses Cartesian coordinates to display values for two variables, typically, for a set of data.
Key Features
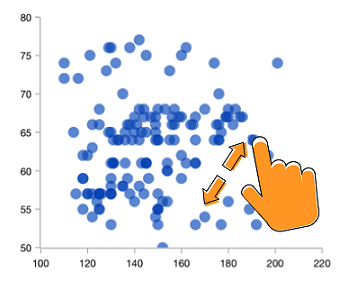
Zooming and Panning
Zoom and pan to visualize data points in any region when dealing with large amounts of data.
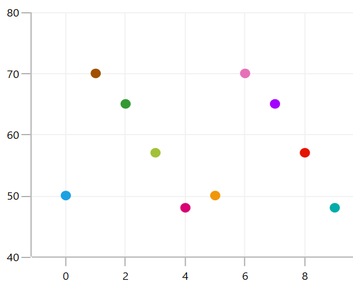
UI Styling
The look and feel of a scatter chart can be customized using built-in APIs.
Code Guideline
Easily get started with the WinUI Scatter Charts using a few simple lines of XAML and C# code example as demonstrated below
<Window x:Class="ChartExample.MainPage"
        xmlns="http://schemas.microsoft.com/winfx/2006/xaml/presentation"
        xmlns:x="http://schemas.microsoft.com/winfx/2006/xaml"
        xmlns:local="using:ChartExample"
        xmlns:d="http://schemas.microsoft.com/expression/blend/2008"
        xmlns:mc="http://schemas.openxmlformats.org/markup-compatibility/2006"
        xmlns:chart="using:Syncfusion.UI.Xaml.Charts"
        mc:Ignorable="d"
        Title="WinUI Scatter Chart" Height="450" Width="700">

    <Grid>
        <chart:SfCartesianChart Height="300" Width="500">
            <!--Setting DataContext-->
            <chart:SfCartesianChart.DataContext>
                <local:ViewModel/>
            </chart:SfCartesianChart.DataContext>

            <!--Initialize the horizontal axis for the WinUI Chart-->
            <chart:SfCartesianChart.XAxes>
                <chart:CategoryAxis/>
            </chart:SfCartesianChart.XAxes>

            <!--Initialize the vertical axis for the WinUI Chart-->
            <chart:SfCartesianChart.YAxes>
                <chart:NumericalAxis/>
            </chart:SfCartesianChart.YAxes>

            <!--Adding Scatter Series to the WinUI Chart.-->
            <chart:ScatterSeries
                        ScatterHeight="9"
                        ScatterWidth="9"
                        ItemsSource="{Binding Data}"
                        XBindingPath="Month"
                        YBindingPath="Target">
            </chart:ScatterSeries>
        </chart:SfCartesianChart>
    </Grid>
</Window>
public class Model
{
public string Month { get; set; }
public double Target { get; set; }
public Model(string xValue, double yValue)
{
Month = xValue;
Target = yValue;
}
}
public class ViewModel
{
public ObservableCollection<Model> Data { get; set; }
public ViewModel()
{
Data = new ObservableCollection<Model>()
{
new Model("Jan", 50),
new Model("Feb", 70),
new Model("Mar", 65),
new Model("Apr", 57),
new Model("May", 48),
};
}
}Learning Resources


WinUI Scatter Chart User Guide
Learn more about the available options to customize WinUI Scatter Charts.

Syncfusion WinUI DataViz & UI Controls
DATA VISUALIZATION
EDITORS
NOTIFICATION
MISCELLANEOUS
CONVERSATIONAL UI