Overview
Axes in a Cartesian chart play a vital role in identifying the values of the visualized data. Charts typically have two axes that are used to measure and categorize data: Vertical axis (y-axis) and horizontal axis (x-axis).
The vertical axis always uses a numerical scale. The horizontal axis supports the following scale types:
- Category
- Numeric
- Date-time
- Logarithmic
Types
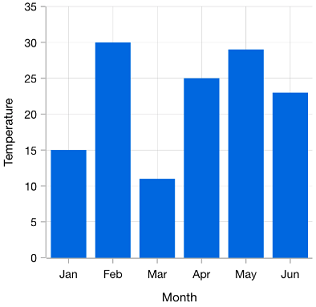
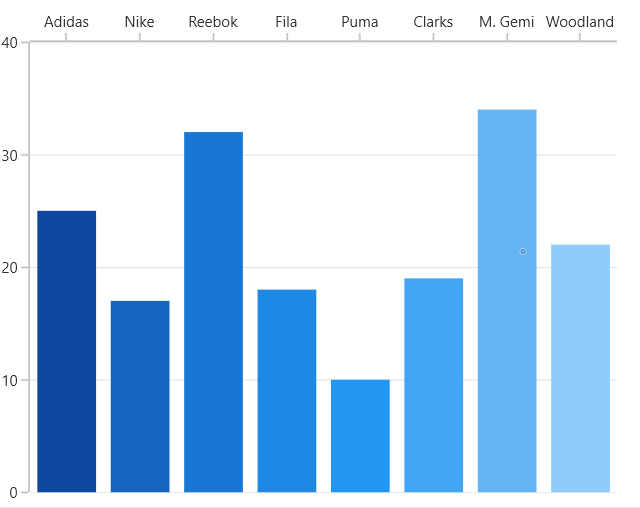
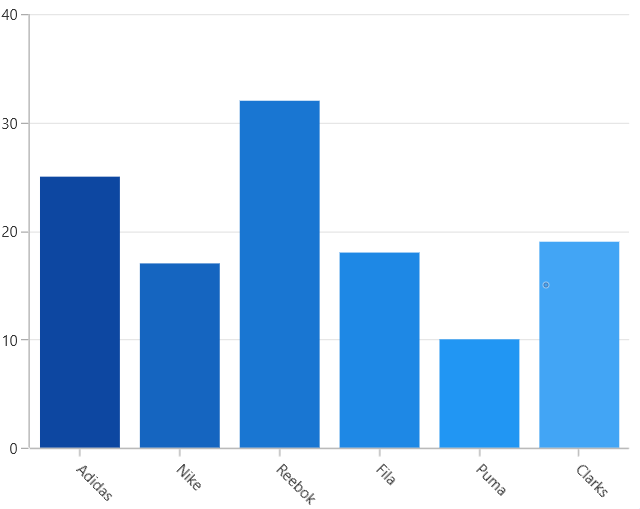
Categorical
The categorical axis is a nonlinear axis that displays text in axis labels.
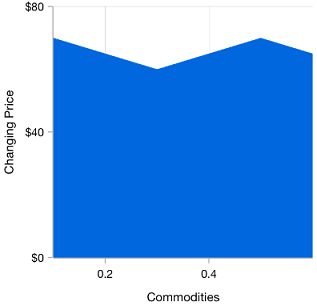
Numerical
The numerical axis is a linear axis that displays numbers with an equal interval in axis labels.
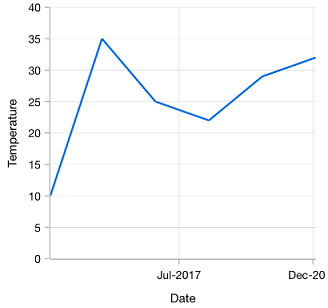
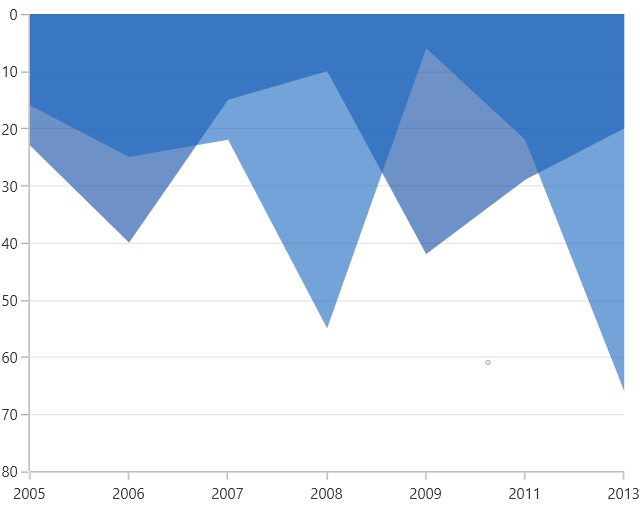
Date-time
The date-time axis displays date-time values with an equal interval in axis labels. It is typically used as an x-axis.

Logarithmic
The logarithmic axis displays values on a logarithmic scale and shows numbers in the axis labels.
Customization
Opposed axis
The Cartesian Charts control supports an opposed axis being rendered on the side opposite to the default position.
Inverted axis values
There is support for inverting axes values in the chart.
Axis labels
Charts offer many customization options for axis labels, including positioning, formatting, and rotation. It also has options to prevent the overlap of labels.