Overview
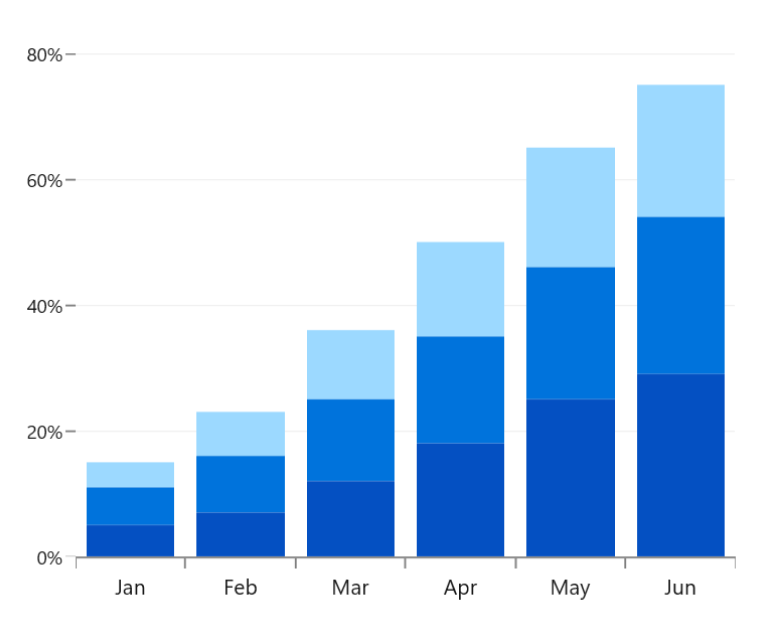
The WinUI Stacked Column Chart visualizes data with y-values stacked in the order of the series. It shows the relationship between individual values and the total sum of the points. Users can create beautiful, animated, real-time, high-performance stacked column charts that also support interactive features such as zooming, scrolling, trackball, tooltip, and selection.
Key features

Grouped stacked chart
Group a series with another series using the grouping name in the chart.

Spacing and width
The stacked column chart provides an option to customize the spacing between two rectangles, which increases or decreases the width of the column.
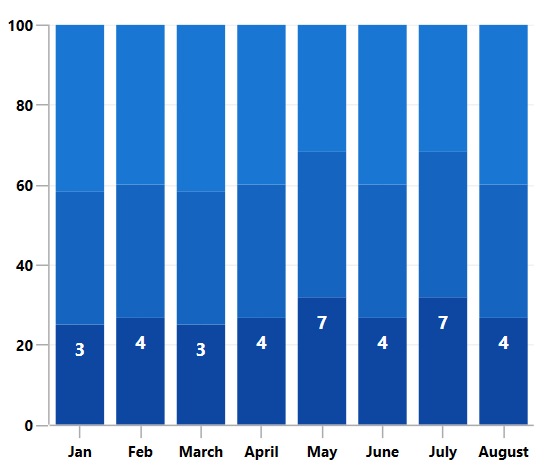
Data labels
Data labels display information about the data points. The foreground, border, and background as well as the default appearance with the desired view can be customized. A data label can be rotated by a specified angle.
Code guideline
Get started with the WinUI Stacked column chart using a few simple lines of XAML and C# code, as demonstrated below.
<Window x:Class="ChartExample.MainPage"
        xmlns="http://schemas.microsoft.com/winfx/2006/xaml/presentation"
        xmlns:x="http://schemas.microsoft.com/winfx/2006/xaml"
        xmlns:local="using:ChartExample"
        xmlns:d="http://schemas.microsoft.com/expression/blend/2008"
        xmlns:mc="http://schemas.openxmlformats.org/markup-compatibility/2006"
        xmlns:chart="using:Syncfusion.UI.Xaml.Charts"
        mc:Ignorable="d"
        Title="WinUI Stacked Column Chart" Height="450" Width="700">

    <Grid>
        <chart:SfCartesianChart Height="300" Width="500">
            <!--Setting DataContext-->
            <chart:SfCartesianChart.DataContext>
                <local:ViewModel/>
            </chart:SfCartesianChart.DataContext>

            <!--Initialize the horizontal axis for the WinUI Chart-->
            <chart:SfCartesianChart.XAxes>
                <chart:DateTimeAxis/>
            </chart:SfCartesianChart.XAxes>

            <!--Initialize the vertical axis for the WinUI Chart-->
            <chart:SfCartesianChart.YAxes>
                <chart:NumericalAxis/>
            </chart:SfCartesianChart.YAxes>

            <!--Adding Stacked Column Series to the WinUI Chart-->

            <chart:StackedColumnSeries
                ItemsSource="{Binding Accidents}"
                XBindingPath="Month"
                YBindingPath="Bus">
            </chart:StackedColumnSeries>

            <chart:StackedColumnSeries
                ItemsSource="{Binding Accidents}"
                XBindingPath="Month"
                YBindingPath="Car">
            </chart:StackedColumnSeries>

            <chart:StackedColumnSeries
                ItemsSource="{Binding Accidents}"
                XBindingPath="Month"
                YBindingPath="Truck">
            </chart:StackedColumnSeries>
        </chart:SfCartesianChart>
    </Grid>
</Window>
public class StackingColumnChartModel
{
public DateTime Month { get; set; }
public double Bus { get; set; }
public double Car { get; set; }
public double Truck { get; set; }
}
public class ViewModel
{
public ObservableCollection<StackingColumnChartModel> Accidents { get; set; }
public ViewModel()
{
this.Accidents = new ObservableCollection<StackingColumnChartModel>();
DateTime mth = new DateTime(2011, 1, 1);
Accidents.Add(new StackingColumnChartModel() { Month = mth.AddMonths(6), Bus = 3, Car = 4, Truck = 5 });
Accidents.Add(new StackingColumnChartModel() { Month = mth.AddMonths(7), Bus = 4, Car = 5, Truck = 6 });
Accidents.Add(new StackingColumnChartModel() { Month = mth.AddMonths(8), Bus = 3, Car = 4, Truck = 5 });
Accidents.Add(new StackingColumnChartModel() { Month = mth.AddMonths(9), Bus = 4, Car = 5, Truck = 6 });
Accidents.Add(new StackingColumnChartModel() { Month = mth.AddMonths(10), Bus = 7, Car = 8, Truck = 7 });
Accidents.Add(new StackingColumnChartModel() { Month = mth.AddMonths(11), Bus = 4, Car = 5, Truck = 6 });
Accidents.Add(new StackingColumnChartModel() { Month = mth.AddMonths(12), Bus = 7, Car = 8, Truck = 7 });
Accidents.Add(new StackingColumnChartModel() { Month = mth.AddMonths(13), Bus = 4, Car = 5, Truck = 6 });
}
}Learning Resources

Explore the WinUI Stacked Column Chart example from GitHub to learn how to render and configure charts.

Stacked column chart user guide
Learn more about the available options to customize WinUI Stacked Column Graphs.
