Overview
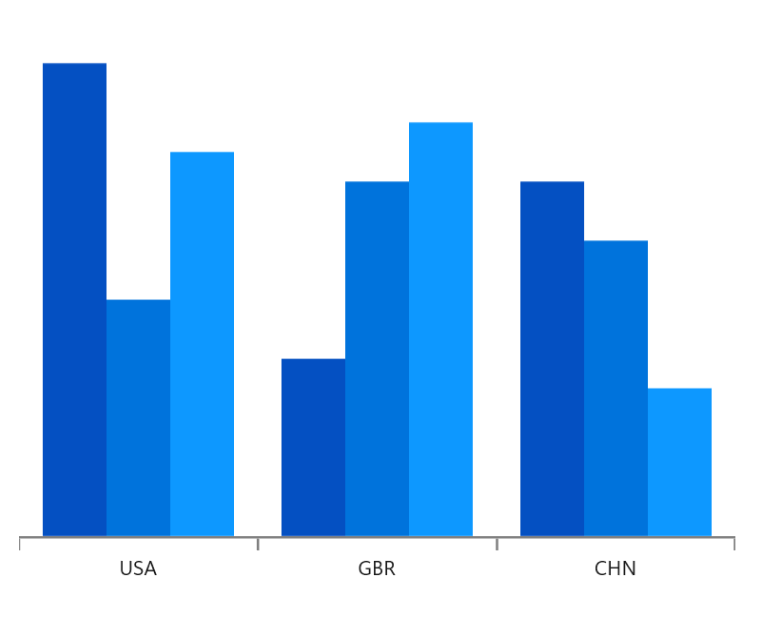
WinUI Column charts (vertical bar chart) use vertical bars (called columns) to display different values for one or more items. The column chart is likely the most common chart type being used. It’s like a bar chart except that the bars are vertical, not horizontal. Points from other series are drawn as columns next to each other. The chart supports zooming, scrolling, tooltips, trackball, and selection.
Key features
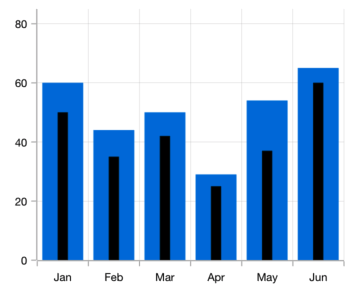
Overlapping charts
Compare two different types of relational values using charts that overlap one another.
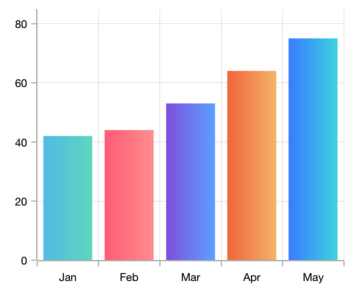
Gradient
Apply gradient colors to visualize data in different colors, improving the readability and appearance of the chart.
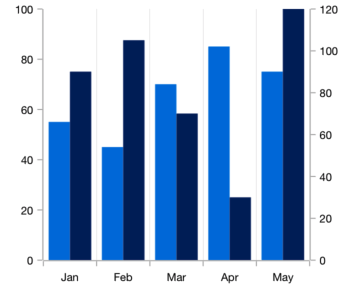
Multiple axes
Use multiple axes to plot different data sets that widely vary from one another.
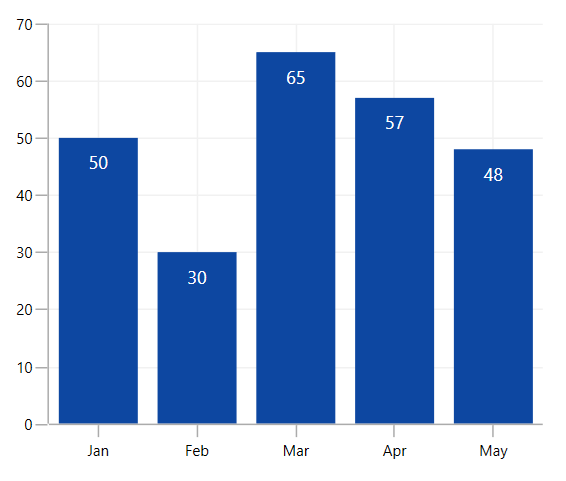
Data labels
Data labels display information about data points. The labels’ foreground, border, and background can be customized. Templates help customize the default label’s appearance. A data label can also be rotated by a specified angle.
Code guidelines
Get started with WinUI column charts using a few simple lines of XAML and C# code like in the example below.
<Window x:Class="ChartExample.MainPage"
        xmlns="http://schemas.microsoft.com/winfx/2006/xaml/presentation"
        xmlns:x="http://schemas.microsoft.com/winfx/2006/xaml"
        xmlns:local="using:ChartExample"
        xmlns:d="http://schemas.microsoft.com/expression/blend/2008"
        xmlns:mc="http://schemas.openxmlformats.org/markup-compatibility/2006"
        xmlns:chart="using:Syncfusion.UI.Xaml.Charts"
        mc:Ignorable="d"
        Title="WinUI Column Chart" Height="450" Width="700">

    <Grid>
        <chart:SfCartesianChart Height="300" Width="500">
            <!--Setting DataContext-->
            <chart:SfCartesianChart.DataContext>
                <local:ViewModel/>
            </chart:SfCartesianChart.DataContext>

            <!--Initialize the horizontal axis for the WinUI Chart-->
            <chart:SfCartesianChart.XAxes>
                <chart:CategoryAxis/>
            </chart:SfCartesianChart.XAxes>

            <!--Initialize the vertical axis for the WinUI Chart-->
            <chart:SfCartesianChart.YAxes>
                <chart:NumericalAxis/>
            </chart:SfCartesianChart.YAxes>

            <!--Adding Column Series to the WinUI Chart-->
            <chart:ColumnSeries ItemsSource="{Binding Data}"
                    XBindingPath="Month"
                    YBindingPath="Target">
            </chart:ColumnSeries>
        </chart:SfCartesianChart>
    </Grid>
</Window>
public class Model
{
public string Month { get; set; }
public double Target { get; set; }
public Model(string xValue, double yValue)
{
Month = xValue;
Target = yValue;
}
}
public class ViewModel
{
public ObservableCollection<Model> Data { get; set; }
public ViewModel()
{
Data = new ObservableCollection<Model>()
{
new Model("Jan", 50),
new Model("Feb", 70),
new Model("Mar", 65),
new Model("Apr", 57),
new Model("May", 48),
};
}
}Learning Resources


Learn more about the available options to customize WinUI column charts.
