Overview
The WinUI area chart is like a line chart that represents time-dependent data and shows it at equal intervals, but it fills the area created by the line. This type of chart can be configured with a numerical, category, date-time and logarithmic axes for the graph. It supports zooming, scrolling, tooltip, trackball, and selection.
Key features
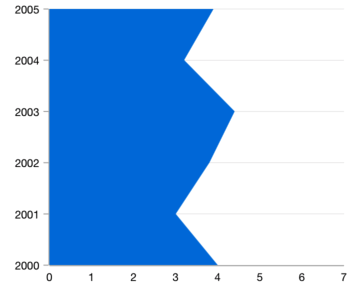
Vertical area chart
Rotate the chart to plot data vertically and view it from a different perspective.
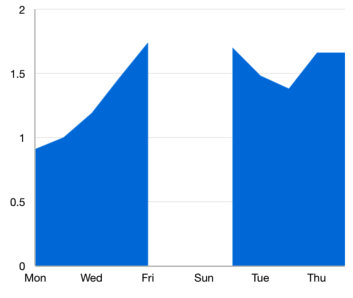
Empty/null point chart
The WinUI area chart handles empty or null data points elegantly.
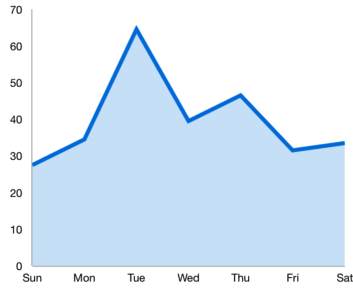
UI styling
Customize the color and border of the chart using built-in APIs to make it visually unique.
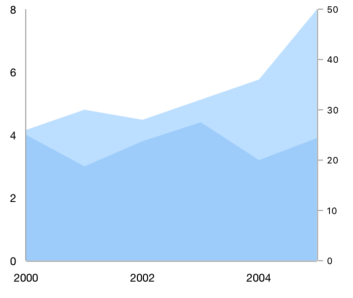
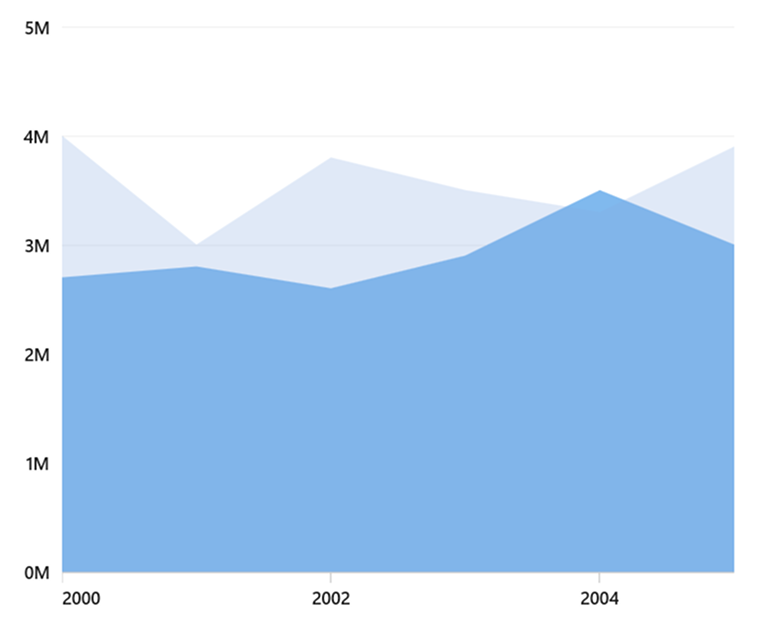
Multiple axes
Use multiple axes to plot different data sets that significantly vary from one another.
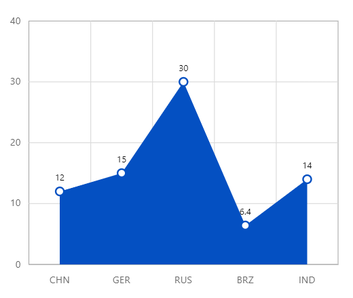
Data labels
Data labels display information about data points. Customize the labels’ foreground, border, and background. Templates allow you to customize the default label’s appearance with a desired view. Rotate a data label by a specified angle.
Code guidelines
Get started with the WinUI area chart using a few simple lines of XAML and C# code like the example below.
<Window x:Class="ChartExample.MainPage"
        xmlns="http://schemas.microsoft.com/winfx/2006/xaml/presentation"
        xmlns:x="http://schemas.microsoft.com/winfx/2006/xaml"
        xmlns:local="using:ChartExample"
        xmlns:d="http://schemas.microsoft.com/expression/blend/2008"
        xmlns:mc="http://schemas.openxmlformats.org/markup-compatibility/2006"
        xmlns:chart="using:Syncfusion.UI.Xaml.Charts"
        mc:Ignorable="d"
        Title="WinUI Area Chart" Height="450" Width="700">

    <Grid>
        <chart:SfCartesianChart Height="300" Width="500">
            <!--Setting DataContext-->
            <chart:SfCartesianChart.DataContext>
                <local:ViewModel/>
            </chart:SfCartesianChart.DataContext>

            <!--Initialize the horizontal axis the WinUI Chart-->
            <chart:SfCartesianChart.XAxes>
                <chart:CategoryAxis/>
            </chart:SfCartesianChart.XAxes>

            <!--Initialize the vertical axis for the WinUI Chart-->
            <chart:SfCartesianChart.YAxes>
                <chart:NumericalAxis/>
            </chart:SfCartesianChart.YAxes>

            <!--Adding Area Series to the WinUI Chart-->
            <chart:AreaSeries ItemsSource="{Binding Data}"
                        XBindingPath="Month"
                        YBindingPath="Target">
            </chart:AreaSeries>
        </chart:SfCartesianChart>
    </Grid>
</Window>
public class Model
{
public string Month { get; set; }
public double Target { get; set; }
public Model(string xValue, double yValue)
{
Month = xValue;
Target = yValue;
}
}
public class ViewModel
{
public ObservableCollection<Model> Data { get; set; }
public ViewModel()
{
Data = new ObservableCollection<Model>()
{
new Model("Jan", 50),
new Model("Feb", 70),
new Model("Mar", 65),
new Model("Apr", 57),
new Model("May", 48),
};
}
}