Skip to content
Blogs
Search blogs
Select Categories
Data Visualization
6 min read
Jan 9, 2026
Charts of the Week: 25 Inspiring Use Cases with Syncfusion Charts
Saravanan Madheswaran
4 min read
Dec 17, 2025
Level Up Your React Charts: Mastering Scrollbar Customization
Gowrimathi S
6 min read
Jan 16, 2026
What’s New in Angular Charts: 2023 Volume 3
Sumankumar G
9 min read
Jan 19, 2026
Chart of the Week: Creating a WinUI Stacked Area Chart to Visualize US Primary Energy Consumption
Nanthini Mahalingam
11 min read
Apr 22, 2025
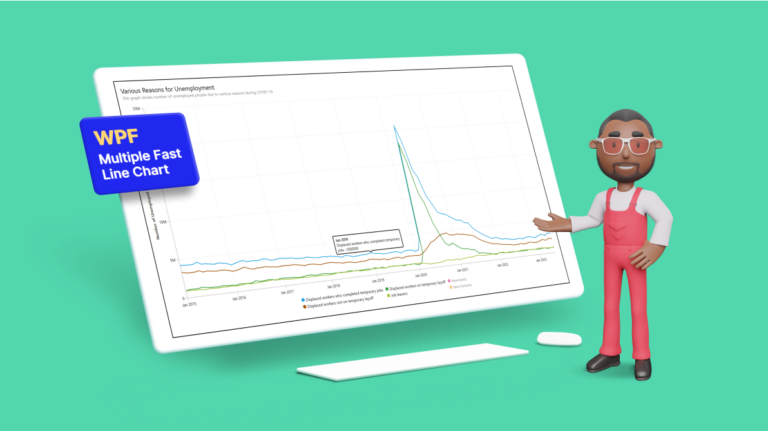
Chart of the Week: Creating a WPF Multiple Fast Line Chart to Display COVID-19's Impact on U.S. Unemployment
Moneeshram Dhanabal
5 min read
Feb 10, 2026
Tree Grid vs. Data Grid: Which One Should You Choose?
Alan Sangeeth
8 min read
Jan 19, 2026
Chart of the Week: Creating a WinUI Spline Area Chart for Top Google Investing Searches in 2022
Nitheeshkumar Thangaraj
6 min read
Jan 19, 2026
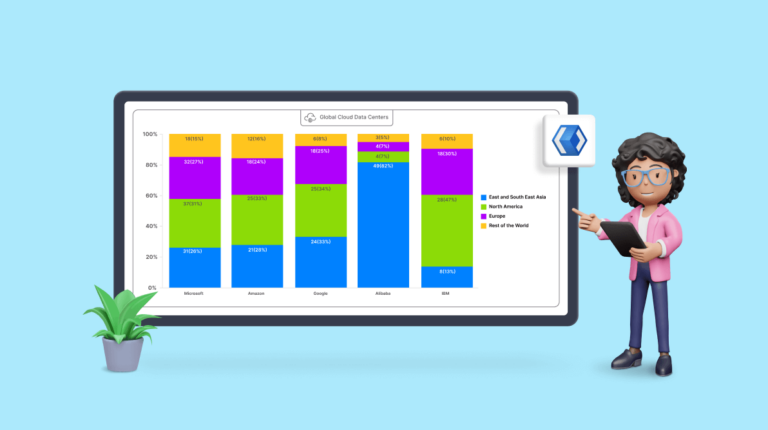
Chart of the Week: Creating a WinUI 100% Stacked Column Chart for Global Distribution of Cloud Provider Data Centers
Saiyath Ali Fathima M
7 min read
Jun 26, 2026
Creating Radial Tree Diagrams with Syncfusion Angular Diagram Library: A Complete Guide
Shyam G
1
…
14
15
16
17
18
19
20
…
22
1
…
16
17
18
…
22

 Saravanan Madheswaran

 Gowrimathi S
 Sumankumar G

 Nanthini Mahalingam
 Moneeshram Dhanabal
 Alan Sangeeth
 Nitheeshkumar Thangaraj
 Saiyath Ali Fathima M

 Shyam G