Skip to content
Blogs
Search blogs
Select Categories
Data Visualization
8 min read
Jan 19, 2026
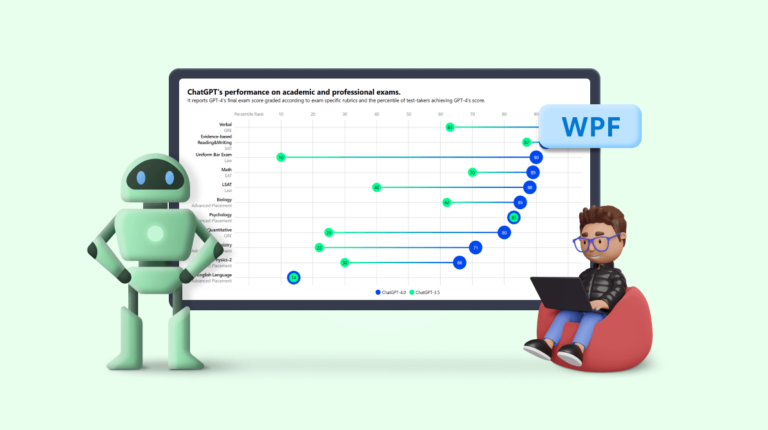
Chart of the Week: Creating a WPF Range Column Chart to Visualize ChatGPT’s Performance in Competitive Exams
Moneeshram Dhanabal
10 min read
Jan 16, 2026
Chart of the Week: Visualize the Transfer Spending and Earning among the Football League Clubs Using WPF Scatter Chart
Nanthini Mahalingam
7 min read
Jan 14, 2026
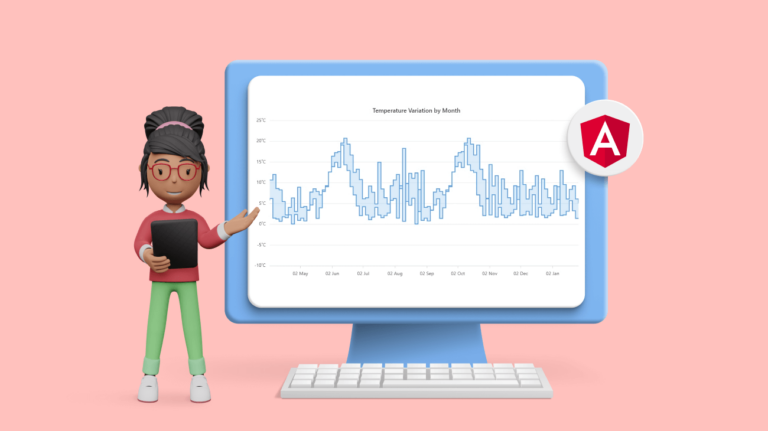
Next-Level Charting: Explore the New Angular Range Step Area Chart
Gowrimathi S
15 min read
Jun 26, 2026
Create an Interactive BPMN Viewer and Editor Using the JavaScript Diagram Control
Sarathkumar V
7 min read
Nov 6, 2025
Top 8 JavaScript Libraries for Data Visualization in 2023
Nipuni Arunodi
5 min read
Jun 24, 2026
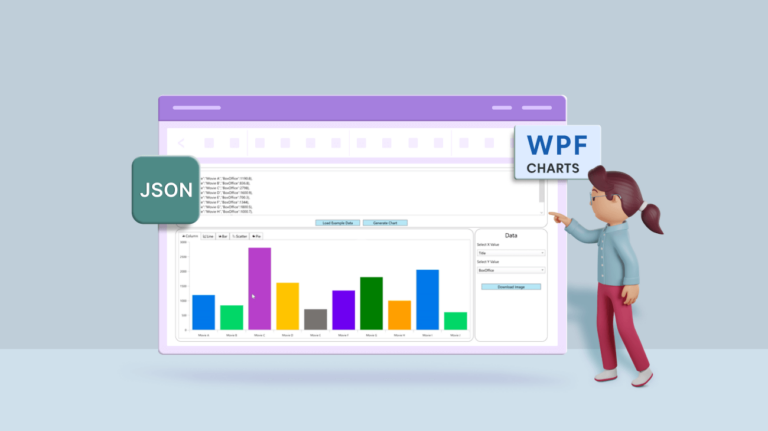
Visualize JSON Data Quickly Using WPF Charts
Karthikeyan V
7 min read
Jun 24, 2026
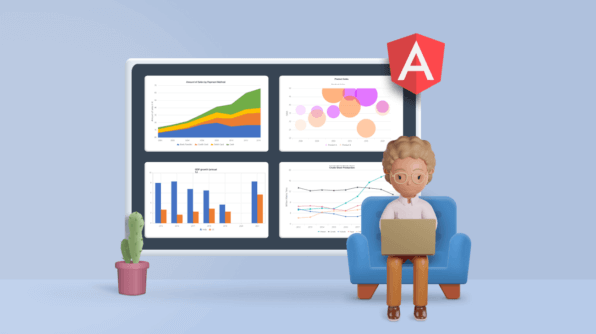
4 Best Angular Charts for Revealing Trends Over Time
Bhuvanesh Valarman
7 min read
Jan 14, 2026
Introducing the New Blazor Spline Range Area Chart
Gowrimathi S
5 min read
Mar 21, 2025
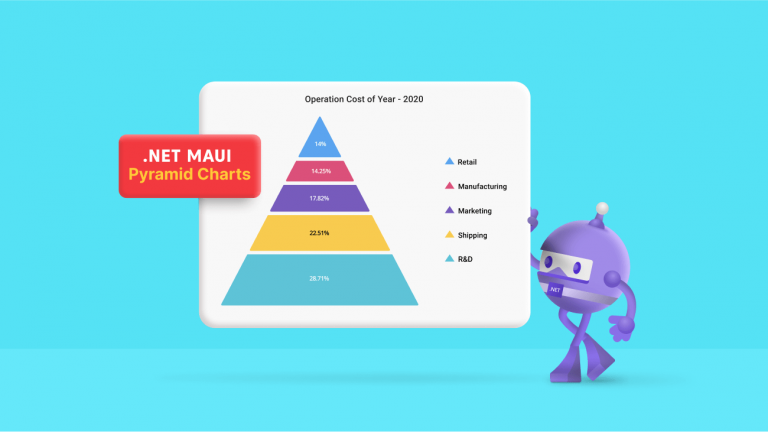
Introducing the New .NET MAUI Pyramid Charts
Saravanan Madheswaran
1
…
15
16
17
18
19
20
21
22
1
…
17
18
19
…
22
 Moneeshram Dhanabal

 Nanthini Mahalingam
 Gowrimathi S

 Sarathkumar V

 Nipuni Arunodi
 Karthikeyan V
 Bhuvanesh Valarman

 Saravanan Madheswaran