Skip to content
Blogs
Search blogs
Select Categories
Data Visualization
11 min read
Jan 19, 2026
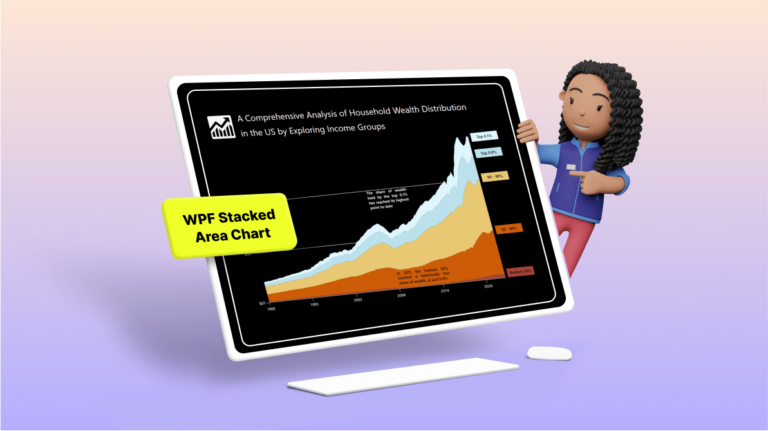
Chart of the Week: Creating a WPF Stacked Area Chart to Visualize Wealth Distribution in the U.S.
Arul Jenith Berkmans
12 min read
Jan 12, 2026
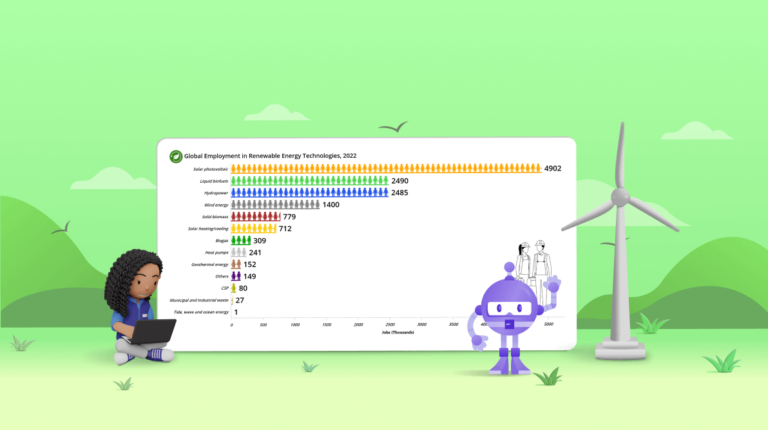
Chart of the Week: Creating a Custom .NET MAUI Bar Chart for Global Renewable Energy Employment Trends
Vimala Thirumalai Kumar
6 min read
Feb 10, 2026
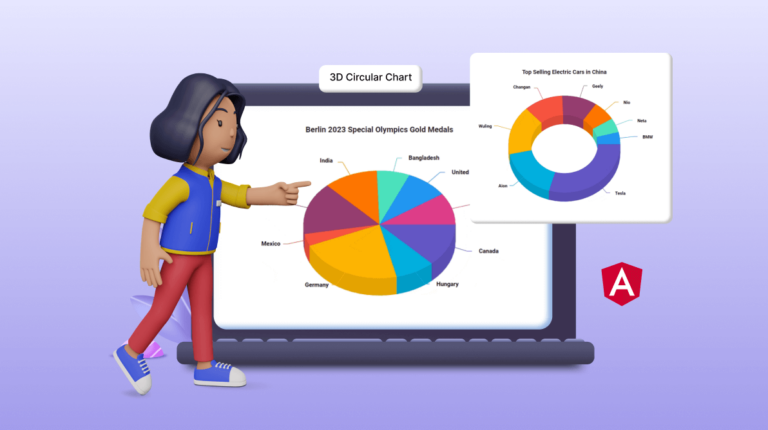
Unveiling the New Angular 3D Circular Charts Component
Veerakumar Narayanasamy
8 min read
Jan 19, 2026
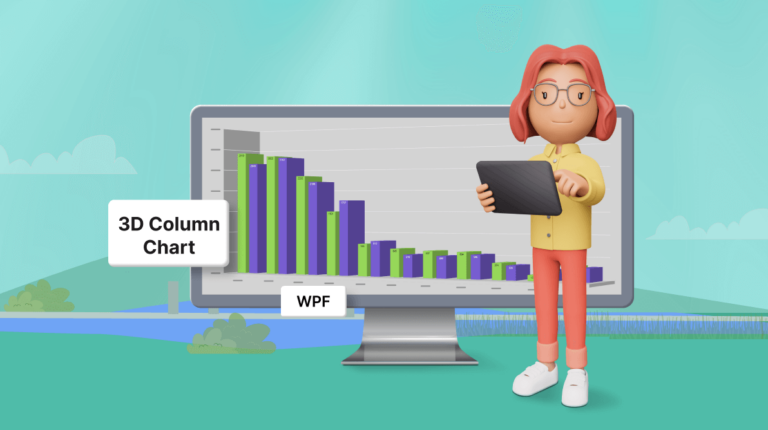
Chart of the Week: Creating a WPF 3D Column Chart to Visualize the Panama Canal’s Shipment Transit Data
Surya Karan Raja
12 min read
Jan 19, 2026
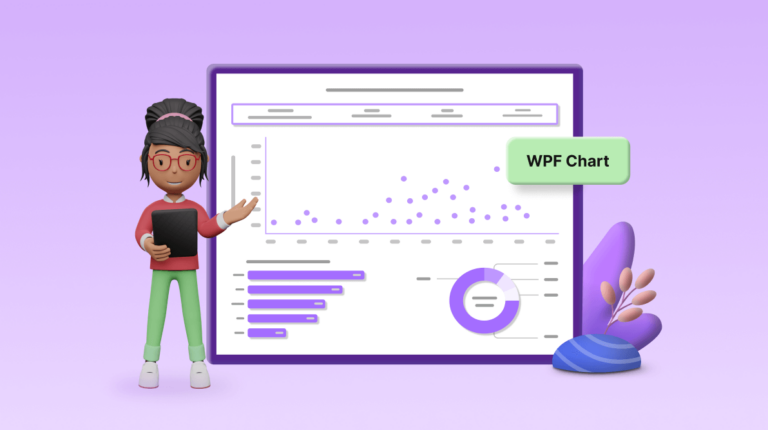
Chart of the Week: Creating a WPF Chart Dashboard to Visualize the 2023 World Billionaires List
Sowndharya Selladurai
8 min read
Apr 22, 2025
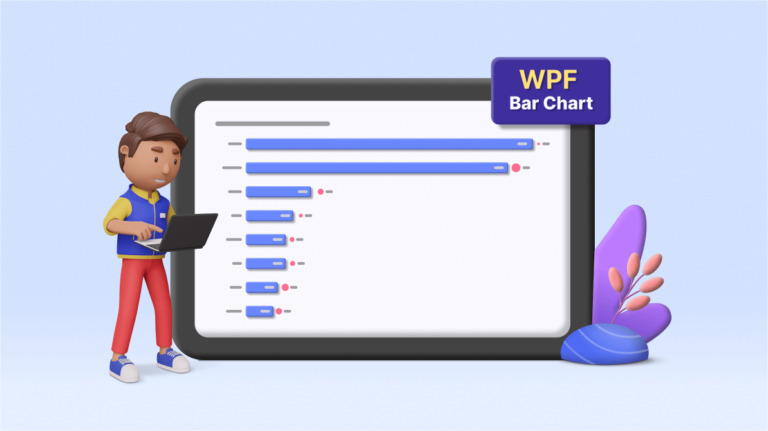
Chart of the Week: Creating a WPF Bar Chart to Visualize the Homelands of America's International Students
Saiyath Ali Fathima M
6 min read
Jan 19, 2026
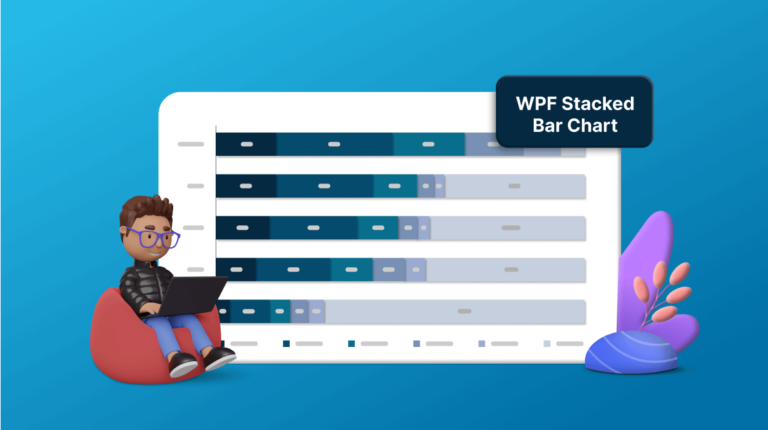
Chart of the Week: Creating a WPF Stacked Bar Chart to Visualize the Social Media Use of US Teens in 2023
Karthikeyan V
6 min read
Jan 9, 2026
Unveiling the New Angular 3D Chart: A Step Forward in Data Visualization
Gowrimathi S
6 min read
Jan 19, 2026
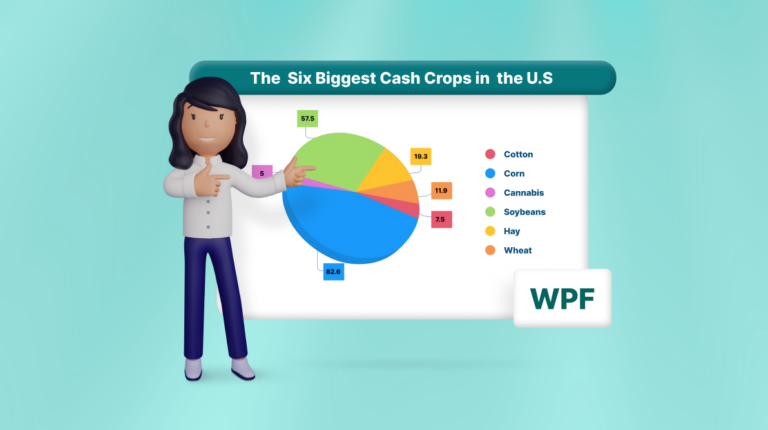
Chart of the Week: Creating a WPF 3D Pie Chart to Display the Biggest Cash Crops in the U.S
Saiyath Ali Fathima M
1
…
13
14
15
16
17
18
19
…
22
1
…
15
16
17
…
22
 Arul Jenith Berkmans
 Vimala Thirumalai Kumar
 Veerakumar Narayanasamy
 Surya Karan Raja
 Sowndharya Selladurai
 Saiyath Ali Fathima M
 Karthikeyan V

 Gowrimathi S