Skip to content
Blogs
Search blogs
Select Categories
Data Visualization
7 min read
Jan 19, 2026
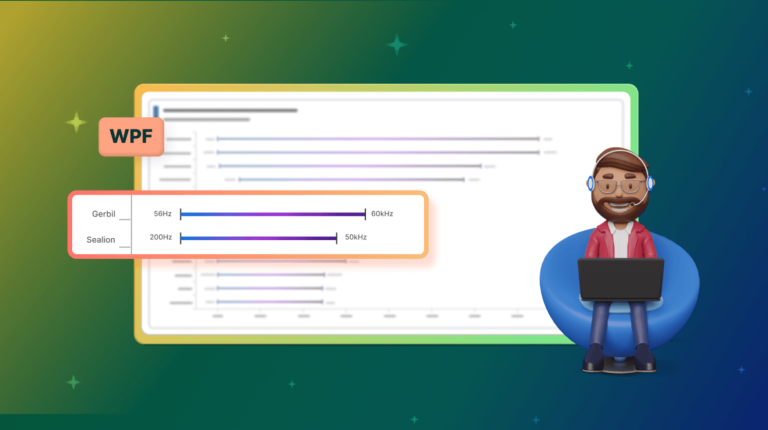
Chart of the Week: Creating a WPF Range Bar Chart to Visualize the Hearing Range of Living Beings
Saiyath Ali Fathima M
11 min read
Jan 9, 2026
Chart of the Week: Creating the .NET MAUI Radial Bar to Visualize Apple’s Revenue Breakdown
Vimala Thirumalai Kumar
9 min read
Mar 21, 2025
Chart of the Week: Creating a .NET MAUI Doughnut Chart to Visualize the World's Biggest Oil Producers
Ezhilarasan Elangovan
6 min read
Jan 19, 2026
Chart of the Week: Creating a WPF Pie Chart to Visualize the Percentage of Global Forest Area for Each Country
Arul Jenith Berkmans
10 min read
Jan 19, 2026
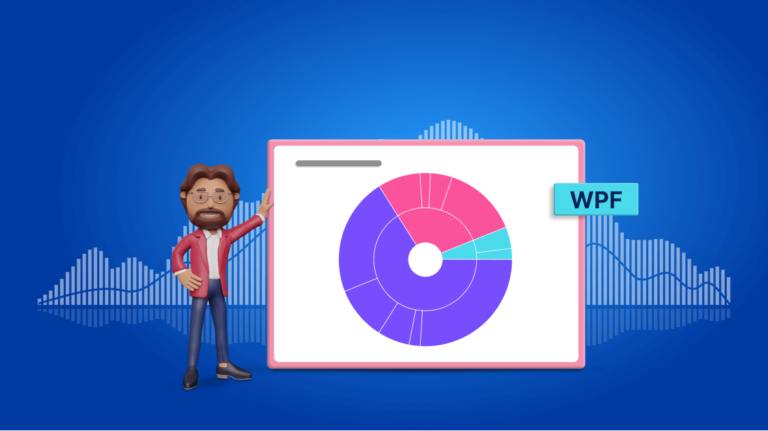
Chart of the Week: Creating a WPF Sunburst Chart to Visualize the Syncfusion Chart of the Week Blog Series
Saiyath Ali Fathima M
8 min read
Jan 9, 2026
Reached 50! A Milestone for the Chart of the Week Blog Series
Vimala Thirumalai Kumar
8 min read
Nov 14, 2025
Performance Optimization in React Pivot Table with Data Compression
Manikandan Murugesan
7 min read
Jan 19, 2026
Chart of the Week: Creating a WPF 100% Stacked Area Chart to Visualize the World Vehicle Production in Major Countries
Karthikeyan V
7 min read
Jan 9, 2026
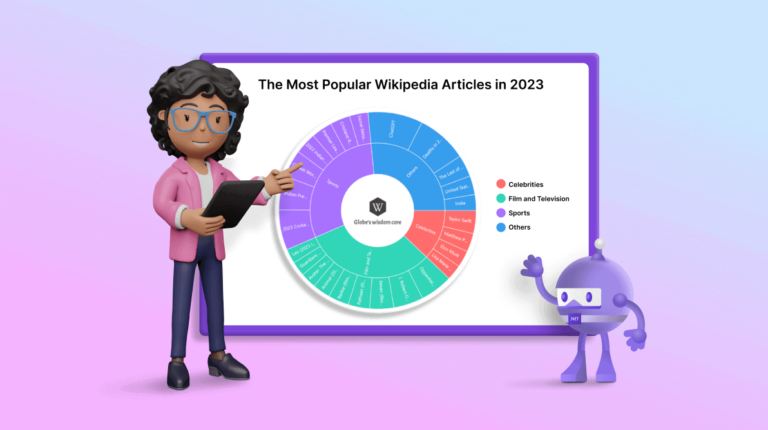
Chart of the Week: Creating a .NET MAUI Sunburst Chart to Visualize the Most Popular Wikipedia Articles
Saiyath Ali Fathima M
1
…
12
13
14
15
16
17
18
…
22
1
…
14
15
16
…
22
 Saiyath Ali Fathima M

 Vimala Thirumalai Kumar

 Ezhilarasan Elangovan

 Arul Jenith Berkmans


 Manikandan Murugesan

 Karthikeyan V