Skip to content
Blogs
Search blogs
Select Categories
Chart
9 min read
Jan 19, 2026
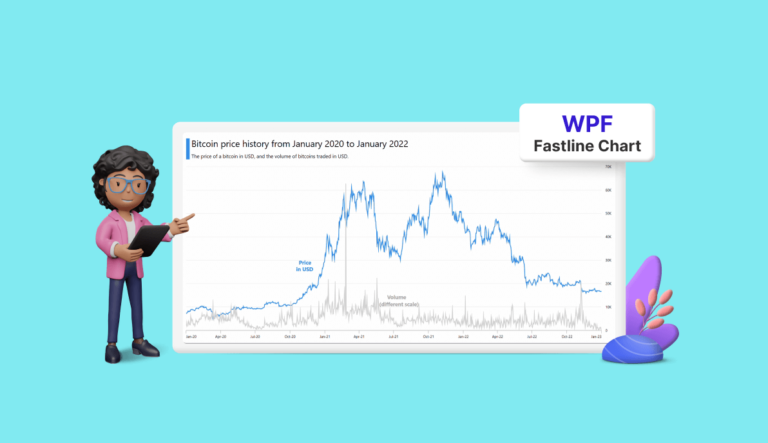
Chart of the Week: Creating a WPF Fast Line Chart for Cryptocurrency Trade Analysis
Vimala Thirumalai Kumar
7 min read
Jan 19, 2026
Chart of the Week: Creating a WPF Column Chart for Countries with the Most Active Volcanoes
Saiyath Ali Fathima M
8 min read
Jan 9, 2026
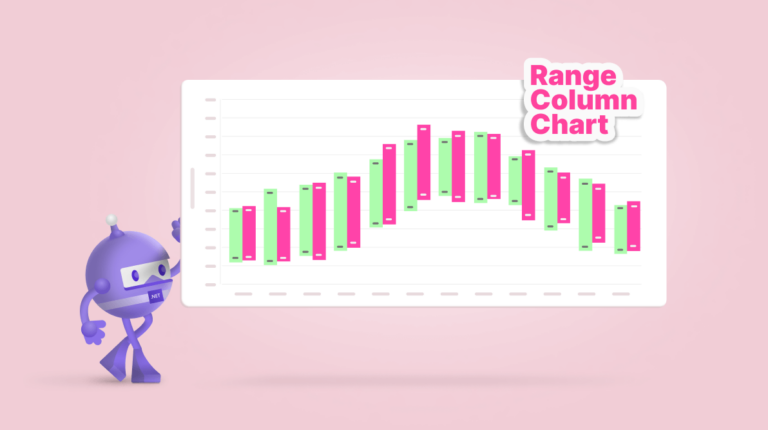
Chart of the Week: Creating a .NET MAUI Range Column Chart to Compare Average Temperature Variations in Rome
Vimala Thirumalai Kumar
5 min read
Feb 10, 2026
Introducing the New .NET MAUI Radio Button Control
Chozarajan Pandiyarajan
8 min read
Jan 16, 2026
Chart of the Week: Creating A Trend Line Using WPF Charts to Visualize Rapid Heating in North American Oceans
Nanthini Mahalingam
8 min read
Jan 19, 2026
Chart of the Week: Creating a WinUI Spline Area Chart for Top Google Investing Searches in 2022
Nitheeshkumar Thangaraj
6 min read
Jan 19, 2026
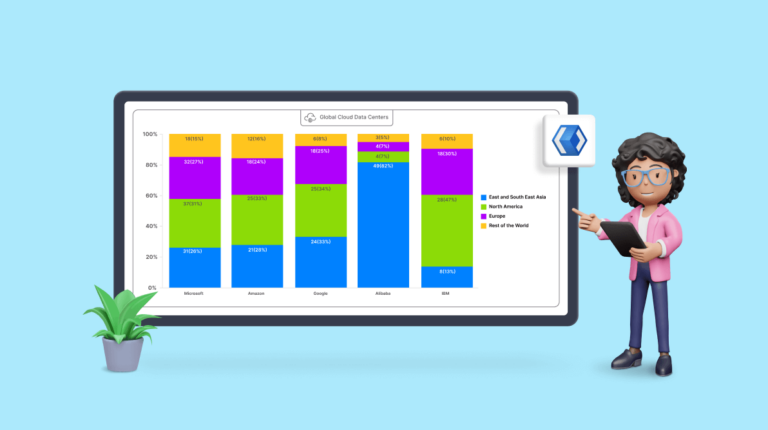
Chart of the Week: Creating a WinUI 100% Stacked Column Chart for Global Distribution of Cloud Provider Data Centers
Saiyath Ali Fathima M
7 min read
Jan 14, 2026
Next-Level Charting: Explore the New Angular Range Step Area Chart
Gowrimathi S
7 min read
Jun 24, 2026
4 Best Angular Charts for Revealing Trends Over Time
Bhuvanesh Valarman
1
…
5
6
7
8
9
10
11
…
13
1
…
7
8
9
…
13
 Vimala Thirumalai Kumar

 Saiyath Ali Fathima M

 Chozarajan Pandiyarajan

 Nanthini Mahalingam

 Nitheeshkumar Thangaraj

 Gowrimathi S

 Bhuvanesh Valarman