Skip to content
Blogs
Search blogs
Select Categories
Chart
9 min read
Jan 12, 2026
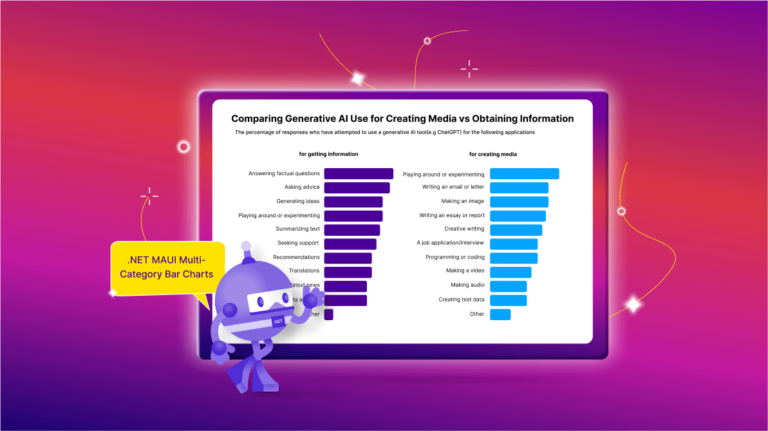
Comparing Generative AI Usage with .NET MAUI Multi-Category Bar Charts
Ezhilarasan Elangovan
11 min read
Jan 9, 2026
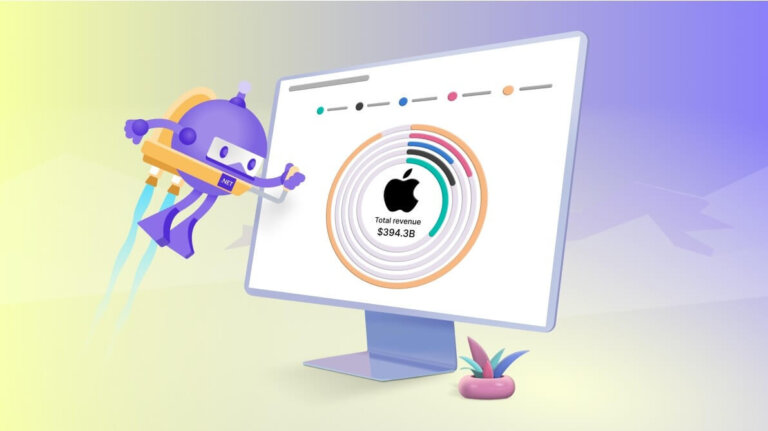
Chart of the Week: Creating the .NET MAUI Radial Bar to Visualize Apple’s Revenue Breakdown
Vimala Thirumalai Kumar
9 min read
Mar 21, 2025
Chart of the Week: Creating a .NET MAUI Doughnut Chart to Visualize the World's Biggest Oil Producers
Ezhilarasan Elangovan
20 min read
Jan 9, 2026
Seamlessly Add Blazor Native UI Components in Hybrid Apps
Mahesh Palanisamy
10 min read
Jan 12, 2026
Chart of the Week: Creating a .NET MAUI Column Chart to Visualize the Corporate Investment in AI
Saiyath Ali Fathima M
11 min read
Feb 10, 2026
Creating a .NET MAUI Fast Line Chart to Visualize the Arctic Sea Ice Extent Since 2000
Sneha Kumar
8 min read
Apr 22, 2025
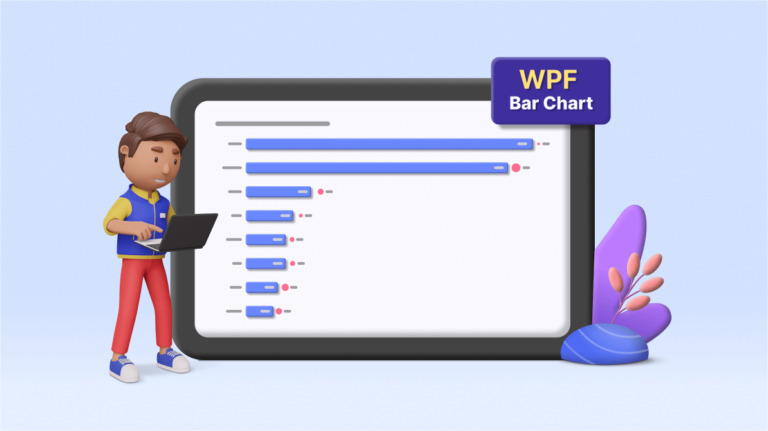
Chart of the Week: Creating a WPF Bar Chart to Visualize the Homelands of America's International Students
Saiyath Ali Fathima M
6 min read
Jan 19, 2026
Chart of the Week: Creating a WPF Stacked Bar Chart to Visualize the Social Media Use of US Teens in 2023
Karthikeyan V
6 min read
Jan 19, 2026
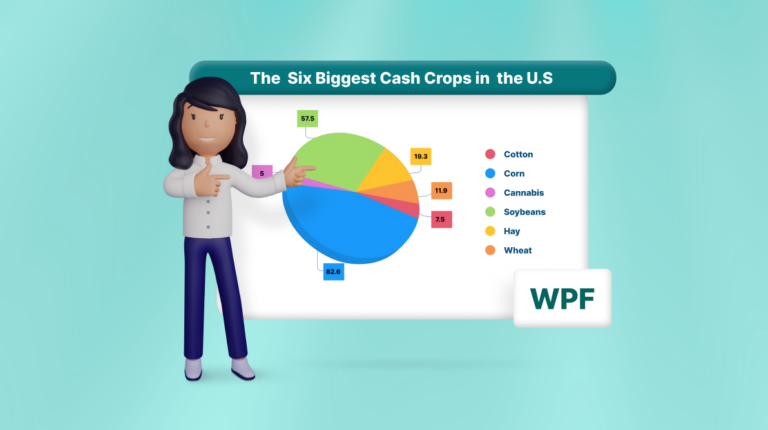
Chart of the Week: Creating a WPF 3D Pie Chart to Display the Biggest Cash Crops in the U.S
Saiyath Ali Fathima M
1
…
4
5
6
7
8
9
10
…
13
1
…
6
7
8
…
13
 Ezhilarasan Elangovan
 Vimala Thirumalai Kumar


 Mahesh Palanisamy

 Saiyath Ali Fathima M

 Sneha Kumar
 Karthikeyan V