Skip to content
Blogs
Search blogs
Select Categories
Chart
7 min read
Feb 10, 2025
Visualizing 2024 US Stock Market Growth and Challenges with React Bar Chart
Swetha Babu
12 min read
Mar 20, 2025
AI-Powered Smart Flutter Spline Chart for Web Traffic Analytics
Natrayan Ramalingam
7 min read
Feb 10, 2025
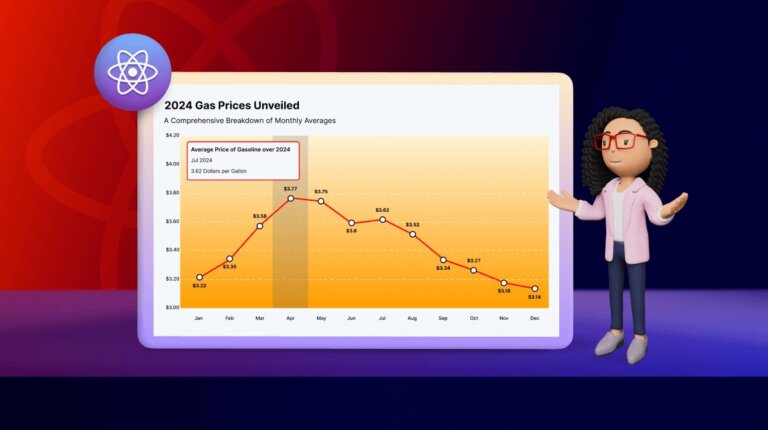
Visualize the Average U.S. Gasoline Price Over Time Using React Line Chart
Swetha Babu
13 min read
Mar 20, 2025
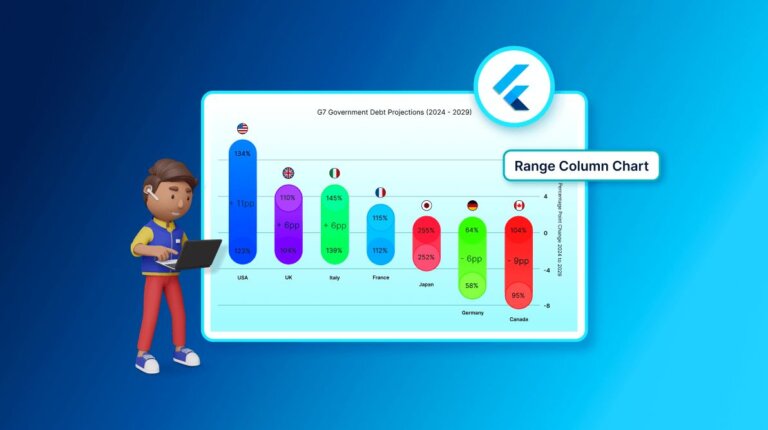
Unlock Insight into G7 Countries' Debt with the Flutter Range Column Chart
Baranibharathi Pandian
7 min read
Jul 6, 2026
The Top 5 React Chart Libraries to Know in 2026 for Modern Dashboards
Gowrimathi S
8 min read
Jun 24, 2026
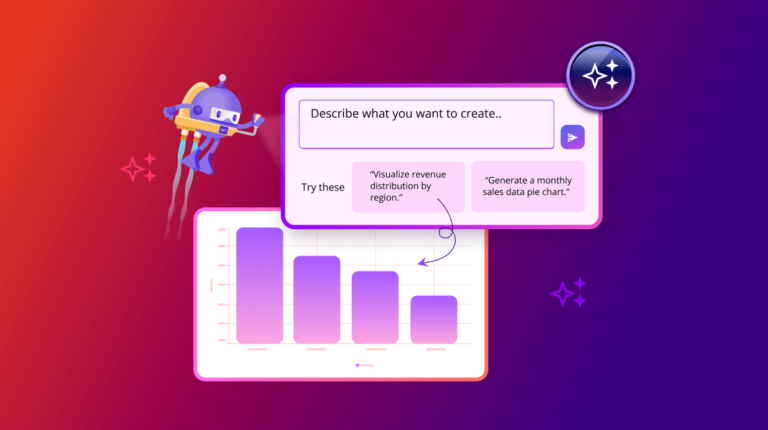
Create Stunning AI-Powered .NET MAUI Charts Using Natural Language
Saravanan Madheswaran
10 min read
Feb 10, 2026
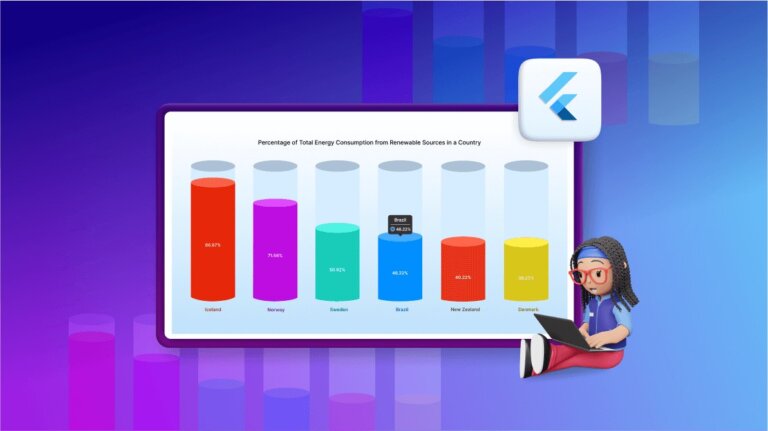
Create a Flutter 3D Column Chart to Showcase the Top 6 Renewable Energy-Consuming Countries
Praveen Balu
9 min read
Jan 15, 2026
Visualizing Skyscraper Data with .NET MAUI Doughnut Chart and Maps
Saiyath Ali Fathima M
5 min read
Nov 6, 2025
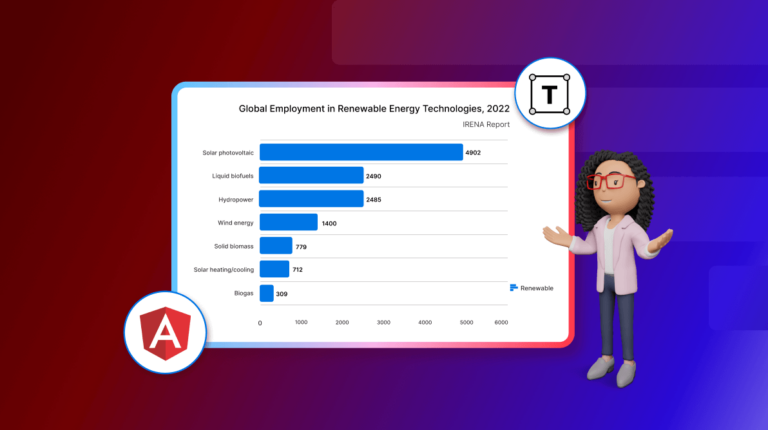
Mastering Font Usage in Angular Charts
Gowrimathi S
1
2
3
4
5
6
7
8
…
13
1
…
4
5
6
…
13

 Swetha Babu

 Natrayan Ramalingam
 Baranibharathi Pandian

 Gowrimathi S
 Saravanan Madheswaran
 Praveen Balu

 Saiyath Ali Fathima M