Skip to content
Blogs
Search blogs
Chart of the week (141)
Chart of the week
Copy RSS feed for this category
8 min read
Jan 9, 2026
Chart of the Week: Create a .NET MAUI Stacked Area Chart to Visualize US School Revenue as a Share of GDP by Funding Sources
Arul Jenith Berkmans
8 min read
Jan 15, 2026
Chart of the Week: Creating a .NET MAUI Dynamic Bar Race Chart for the Top 10 Populations in the World
Karthikeyan V
7 min read
Jan 12, 2026
Chart of the Week: Creating a .NET MAUI Candle Chart to Analyze Tesla’s (TSLA) Stock Prices
Nitheeshkumar Thangaraj
6 min read
Jan 15, 2026
Chart of the Week: Creating a .NET MAUI Column Chart to Visualize Top Insurance Companies
Sowndharya Selladurai
6 min read
Jan 19, 2026
Chart of the Week: Creating a WPF 3D Pie Chart to Display the Biggest Cash Crops in the U.S
Saiyath Ali Fathima M
9 min read
Jan 19, 2026
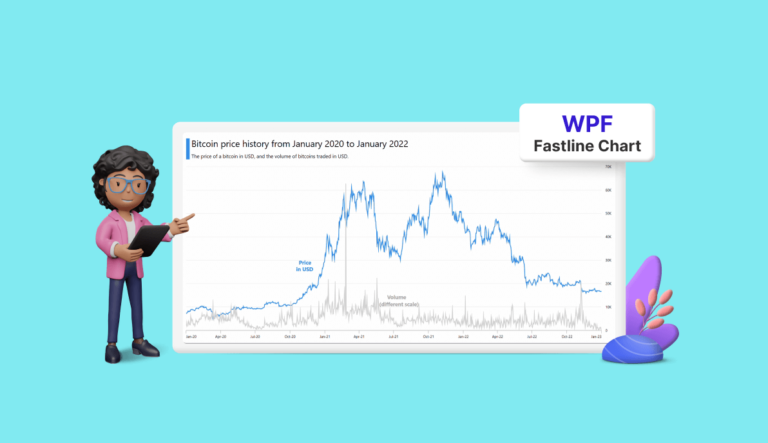
Chart of the Week: Creating a WPF Fast Line Chart for Cryptocurrency Trade Analysis
Vimala Thirumalai Kumar
10 min read
Jan 15, 2026
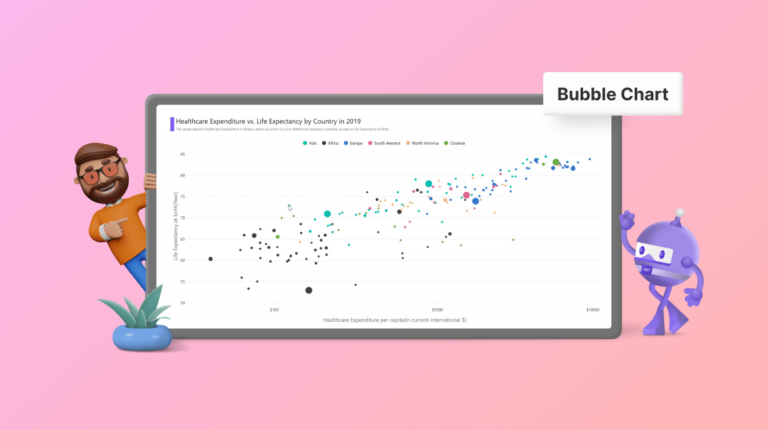
Chart of the Week: Creating a .NET MAUI Bubble Chart to Visualize Healthcare Spending and Life Expectancy Data
Dhanaraj Rajendran
6 min read
Jan 9, 2026
Charts of the Week: 25 Inspiring Use Cases with Syncfusion Charts
Saravanan Madheswaran
8 min read
Jan 9, 2026
Chart of the Week: Creating a .NET MAUI Tornado Chart for Comparing Petrol and Diesel Prices in the UK
Sowndharya Selladurai
1
…
10
11
12
13
14
15
16
1
…
12
13
14
…
16

 Arul Jenith Berkmans

 Karthikeyan V

 Nitheeshkumar Thangaraj

 Sowndharya Selladurai

 Saiyath Ali Fathima M
 Vimala Thirumalai Kumar
 Dhanaraj Rajendran

 Saravanan Madheswaran