We use cookies to give you the best experience on our website. If you continue to browse, then you agree to our privacy policy and cookie policy.

Columns define the schema of a data source in Blazor Gantt Chart component. It supports formatting, column definitions, column chooser, column menu, column reordering, and other important features. The operations such as sorting, filtering, and searching can be performed based on column definitions
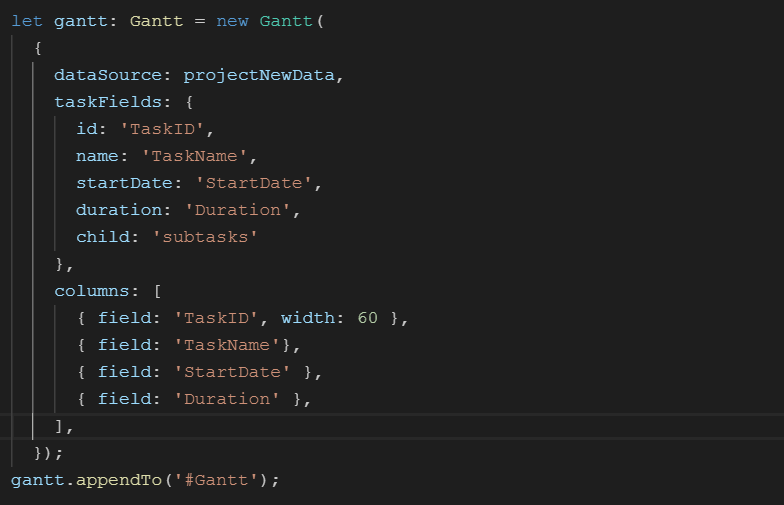
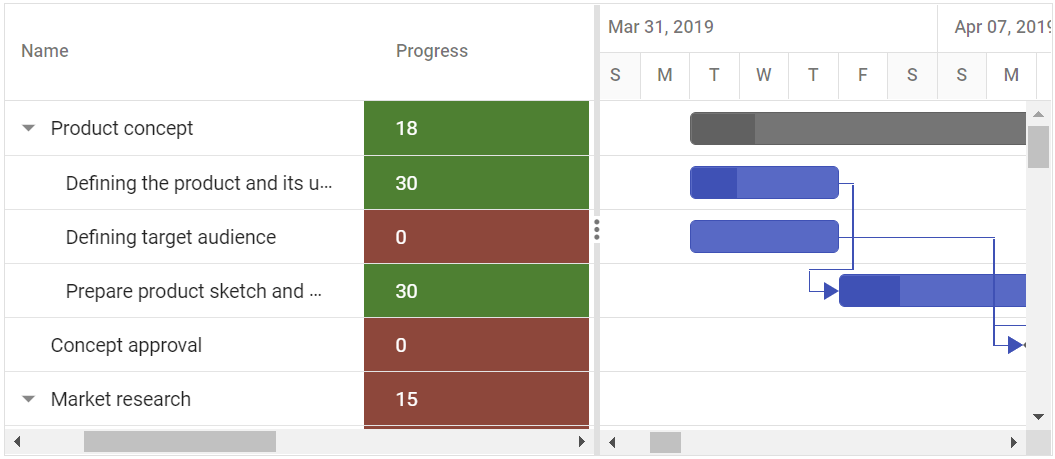
You can define columns explicitly to display the needed items in a Gantt Chart. You can also enhance the appearance of columns by setting the header text, text alignment, cell value format, and width.
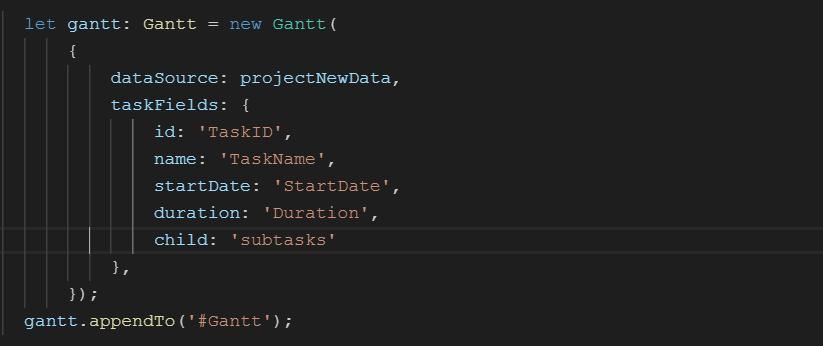
When the column collection is not specified, Gantt Chart will create columns definition for the users by creating a column object from the data source.
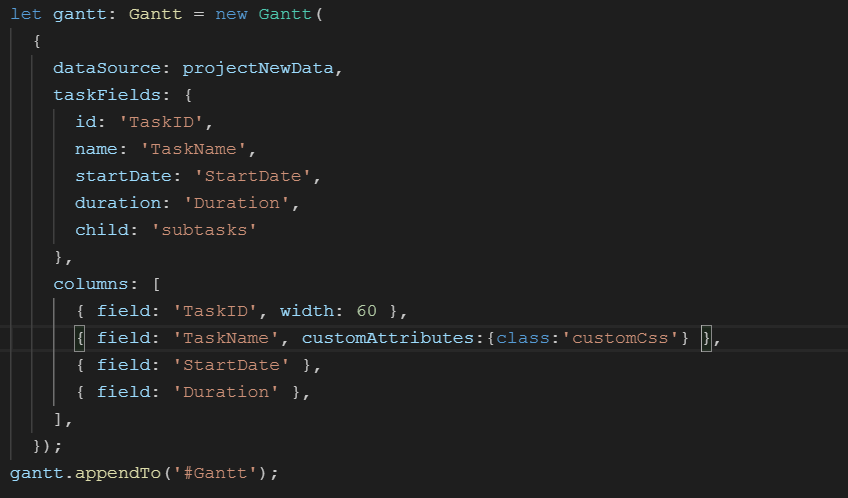
Users can decorate each cell element of a Gantt Chart with their own attributes by customizing styles, adding additional class names, etc.
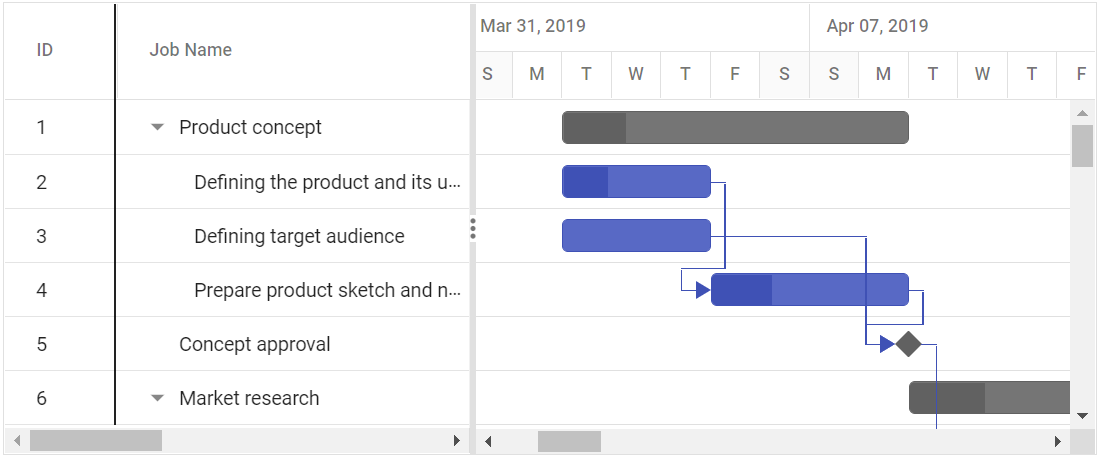
Change column width by simply dragging the right corner of the column header. A scroll bar appears when the Gantt Chart content width exceeds the element width.

Reorder Gantt Chart columns either through user interaction or programmatically. Simply dragging a column header into the desired column position will reorder the columns of a Gantt Chart.
The value accessors specify how the cell value is to be retrieved from the data. The preferred value accessors can be used when the row data is not just a simple object.

Customize cell styles using CSS or programmatically.
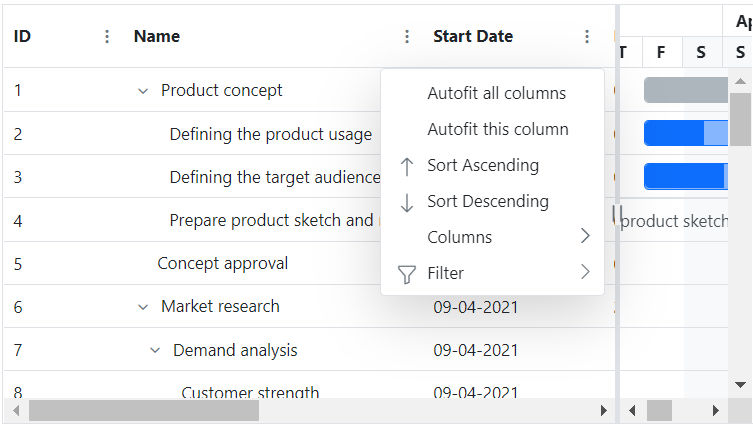
Allows performing various column-based actions, such as sorting, filtering, hide or show columns etc., with the help of Angular Gantt Chart column menu. Menu items can also be customized to list only the preferred actions.
 You are using an outdated version of Internet Explorer that may not display all features of this and other websites. Upgrade to Internet Explorer 8 or newer for a better experience.