Overview
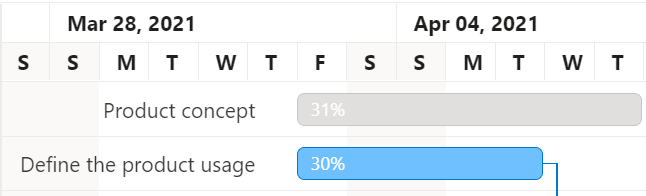
A timeline is used to represent the project duration as individual cells with defined units and formats. It displays project tasks in chronological order with progress, tasks dependencies, and more.
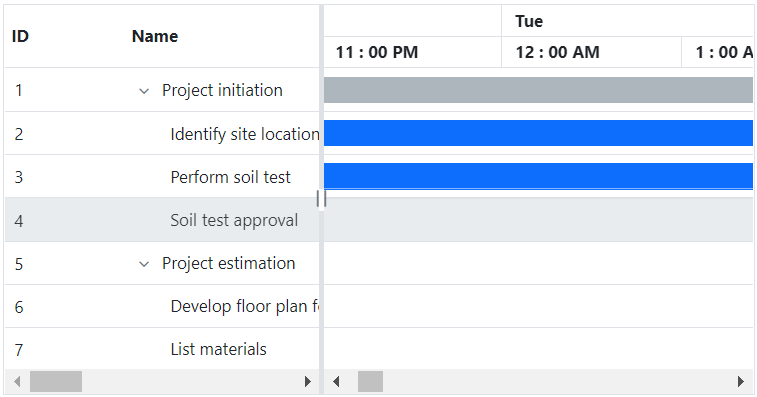
Tier Layout
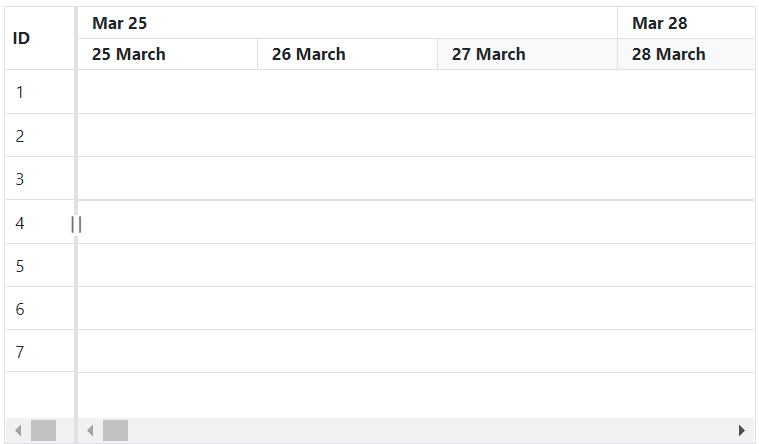
The Vue Gantt Chart component has a two-tier layout: top tier and bottom tier. The two tiers allow users to view two different timescales at once. The units and labels of both tiers are customizable to meet any application requirement.
Timeline modes
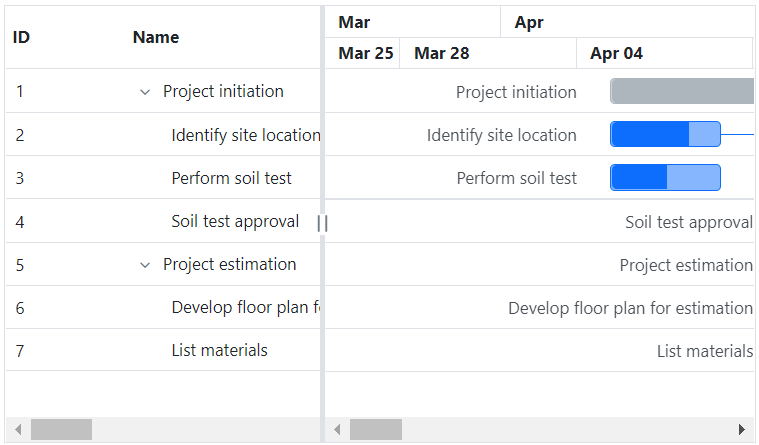
The Vue Gantt Chart timeline supports various built-in view modes modes: hour, week, month, and year. Modes are chosen based on the timescale of the project.
Zooming
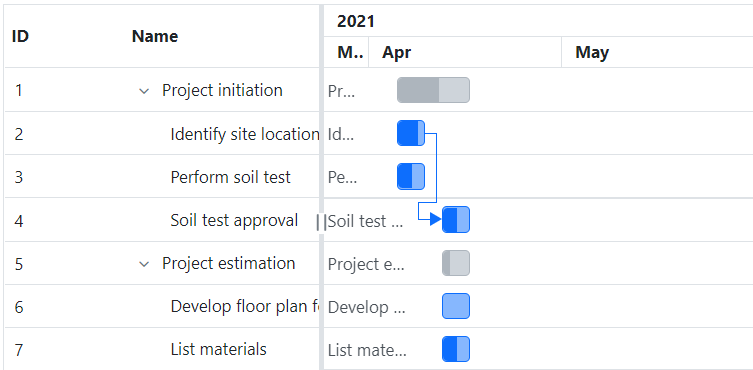
Users can view the tasks in a project clearly in timespans from minutes to years using built-in zooming actions. Also the zoom-to-fit option allows users to view all the tasks in a single view port.
Working days and holidays
Nonworking days such as holidays and weekends can be customized. Working hours in a day for a project can be defined. This helps users keep track of each task and resource task status based on the working time of the company.
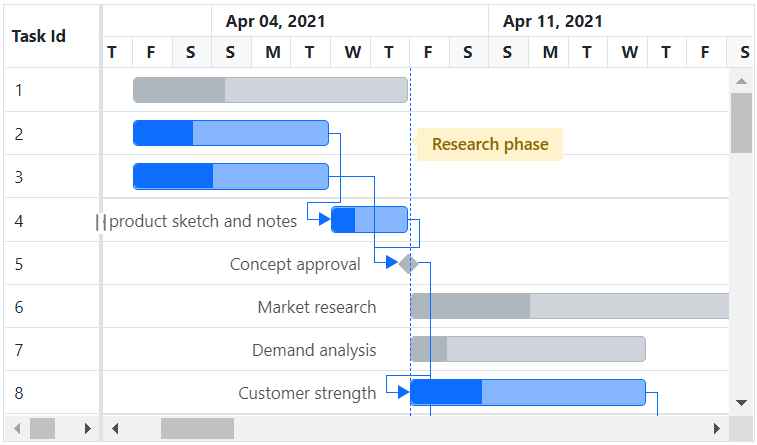
Event markers
Highlight important events in a project. For all the tasks in a project or a particular task, an event can be highlighted to indicate an important activity or day.
Our Customers Love Us


See Real Success Stories
Developers around the world trust Syncfusion’s Essential Studio to simplify complex projects and speed up delivery. With a vast library of UI controls, powerful SDKs, and reliable support, Essential Studio helps teams build enterprise-ready applications with confidence.
Read Our Customer StoriesIndustry
Software development
75% Cost reduction
50% Faster development
Industry
Utilities (oil and gas)
450+ hours saved
Streamlined processes and hours of development effort saved.
Advanced, flexible features
Empowered users through robust and versatile functionality.
Industry
Software and technology
1000+ of hours saved
Accelerated development with enterprise-ready UI components.
Efficient file management
Streamlined workflows with document libraries without building them from scratch.
Industry
Software and technology
2 Years of delay avoided
Two years of delays prevented with proactive planning.
On-time delivery
Projects delivered on schedule using trusted controls.
Industry
IT services and IT consulting
Improved performance
Large datasets handled with easy customization and quick debugging.
Highly customizable
Plug-and-play controls with quick template integration.
Industry
Professional services
Instant access
Quick availability of features and resources.
Reduced dependencies
Fewer dependencies for faster development.