React Charts - Evaluation Guide
Evaluate the Syncfusion React Charts for Enterprise Adoption
The Syncfusion React Charts support operational dashboards, time-series analytics, financial reporting, IoT telemetry, business intelligence, reporting, and monitoring workflows. The supplied evidence describes an SVG-based React Chart component with local and remote data integration, large-data visualization techniques, real-time updates, extensibility, accessibility features, export capabilities, and application-managed authentication, authorization, networking, and security controls.
Use the decision framework first, then expand only the technical topics required by the target dashboard, reporting solution, or analytical workflow.
Quick evaluation framework
Evaluate in this order so an unsupported runtime, integration boundary, workload, or security responsibility is identified before advanced customization begins.
| Order | Evaluation area | What to assess | How to verify | Decision impact |
|---|---|---|---|---|
| 1. | Runtime fit | Frameworks, React versions, SSR model, and browsers | Match the target environment to the compatibility tables and verify every stated condition. | Unsupported runtime requirements can stop the evaluation early. |
| 2. | Build and application fit | Build tools, package formats, state, theming, and CI/CD | Install Charts in the real repository and run the existing build and test pipelines. | Reveals integration work before deeper product testing. |
| 3. | Data and API fit | Adaptors, back ends, authentication, API stability, and extensibility | Connect a production-shaped endpoint and implement one representative chart workflow. | Shows whether Charts fits existing service and application boundaries. |
| 4. | Performance fit | Visible-range loading, real-time updates, series count, and dashboard scale | Reproduce expected data volume, update rate, interactions, and chart combinations on target hardware. | Determines whether the selected configuration meets workload needs. |
| 5. | Security and procurement fit | Responsibility boundaries, CSP, deployment, export, and compliance evidence | Validate runtime behavior with DevTools and review the cited assurance documents. | Clarifies what Charts provides and what the application must enforce. |
| 6. | Final decision | Conditions, limitations, evidence, and unresolved risks | Record pass, conditional pass, or fail for every required area. | Prevents strong visual features from hiding an architectural mismatch. |
1
Architecture compatibility
Assess React Charts compatibility with the existing application architecture, including frameworks, React versions, build tooling, deployment models, and organizational standards. Review documented support for SSR, state management, micro-frontends, browsers, theming, testing infrastructure, and module formats to validate alignment with project requirements.
Framework and runtime compatibility
Verify that React Charts supports the application’s framework, React version, rendering model, and runtime environment. This helps ensure seamless integration, compatibility with the existing technology stack, and reliable behavior across deployment scenarios.
Framework and environment support
Confirm that the target application environment is covered and note any setup condition.
| Deployment environment | Coverage and condition |
|---|---|
| React 18/19 SPA | Supported with the standard React application setup. |
| Next.js App Router | Supported when the Chart is placed inside the documented client component boundary. |
| Next.js Pages Router | Supported across the documented Pages Router versions. |
| Vite SPA | Installs as a normal package dependency without Chart-specific build configuration. |
| Remix | Supported; validate client hydration in the production route. |
| Gatsby SSG | Supports static generation followed by browser hydration. |
| Electron | Runs as a React component in Electron's renderer process. |
| Micro-Frontend (Module Federation) | Supported when the shell shares Syncfusion packages as a singleton. |
| Micro-Frontend (Single-SPA) | Runs as a client-rendered React component within a single-SPA module. |
| Preact | Supported through Preact's React compatibility layer. |
Use the published system requirements as the versioned baseline.
React version compatibility
Match the application’s React version to the minimum Syncfusion version and use release history for upgrade planning.
| React version | Syncfusion Minimum Version | Approximate release year | Coverage |
|---|---|---|---|
| React 16 | Syncfusion v16 | 2018 | Supported in the cited compatibility documentation. |
| React 17 | Syncfusion v18 | 2020 | Supported in the cited compatibility documentation. |
| React 18 | Syncfusion v20 | 2022 | Supported in the cited compatibility documentation. |
| React 19 | Syncfusion v29 | 2024 | Supported from Syncfusion v29 according to the cited compatibility information. |
| React Strict Mode | No minimum version constraint. | — | Supported; No duplicate state mutation or double-invoke issue in development. |
| Organization-pinned React version | N/A | — | Uses the host application React version; verify package alignment in the actual lockfile. |
| Future React major version planning | Reviewable in release history. | — | Use release history for planning; past adoption timing is not a guarantee for future versions. |
SSR and server component integration
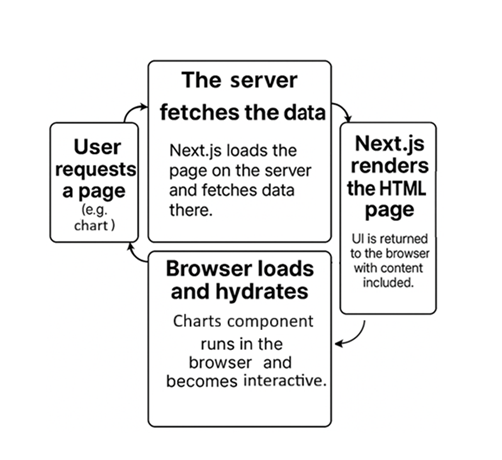
React Charts uses a client-component boundary in Next.js App Router. Test data loading, Suspense, ISR, and Edge behavior in the target route.
- Prepare only the data required for the initial view; initialize interactive chart behavior after the client boundary is active.
- Place the Chart inside the documented App Router client component so measurements, animation, SVG, and Canvas operations do not run as server components.
- Use a Suspense boundary when chart data or modules load asynchronously, and verify that surrounding page content can stream independently.
- Test hydration on ISR-regenerated pages with the real data-fetching strategy and cache behavior.
- Confirm that the selected Edge deployment has no application-side Node-only dependency even though the Chart package does not introduce one.
Browser and runtime support
Use the versioned browser matrix for release planning. Internet Explorer requires the documented Promise polyfill.
| Browser runtime | Coverage and condition |
|---|---|
| Chrome (latest) | Fully supported |
| Firefox (latest) | Fully supported |
| Safari (latest) | Fully supported |
| Microsoft Edge (latest) | Fully supported |
| Opera (latest) | Fully supported |
| Internet Explorer 11+ (EOL — June 2022) | Supported when the ES6 Promise polyfill is added, as noted in the documentation. |
Build, package, and module compatibility
Confirm that React Charts aligns with existing build processes, package management, and module architectures for seamless integration without requiring specialized tooling or Chart-specific build customization.
Build compatibility
Validate the package in the actual production build. Check imported modules, CSS, TypeScript strict mode, and any Turbopack or SSR conditions.
| Environment or toolchain | Syncfusion React Charts Support |
|---|---|
| Webpack | Integrates as an npm/ESM dependency without a proprietary plugin. |
| Vite | Uses the ESM package path without Chart-specific build configuration. |
| Turbopack | Core rendering and data binding use the ESM export; validate CSS and SSR or Suspense behavior in the target application. |
| Nx / Turborepo (Monorepo) | Uses normal workspace dependency management without custom executors or generators. |
TypeScript Strict Mode ("strict": true) |
Typed public APIs support strict mode without standard-use @ts-ignore workarounds. |
| Next.js (App & Pages Router) | Supported in both routers; apply the client boundary where the route requires it. |
| Create React App (legacy — deprecated) | Existing projects remain supported; use Vite for new projects or migrations. |
Package distribution and module support
The package supports ESM, CommonJS, and UMD. Use the format required by the application and test environment.
| Module format | Support and condition | Notes |
|---|---|---|
| ESM | Fully supported | Primary distribution in dist/es6; use it with Vite, Next.js, and Webpack 5. |
| CJS (CommonJS) | Supported | Available for legacy Node and test loaders, including Jest, RequireJS, and SystemJS. |
| UMD | Fully supported | Available as a minified UMD bundle for script, AMD, or CommonJS loading. |
Micro-frontend and Module Federation compatibility
Use shared dependency configuration to avoid duplicate packages and version conflicts. Runtime instance isolation is reviewed separately.
| Micro-Frontend Scenario | Coverage |
|---|---|
| Multiple charts on the same page | Each instance maintains independent state with no cross-instance interference. |
| Module Federation shell (Webpack) | Share the package at shell level to prevent duplicate bundles and version conflicts. |
| Vite Module Federation | Use the Vite federation plugin with the same shared-singleton policy. |
| Lazy-loaded route (React.lazy) | Loads on demand without Chart-specific configuration. |
Application architecture integration
Evaluate how React Charts integrates with existing state management, data-flow patterns, and design-system standards without requiring architectural refactoring.
State management neutrality
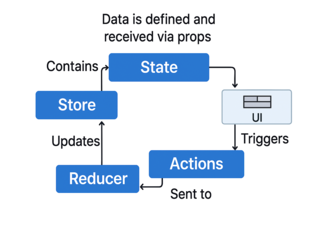
The Charts does not introduce a global store, context provider, or proprietary data layer. It accepts data through props and emits events, allowing Redux, Zustand, TanStack Query, MobX, Jotai, Recoil, and React Context to remain under application ownership.
Theming and design system integration
Use built-in themes, chart properties, palettes, and SCSS overrides to match the design system. Theme Studio is not supported for Charts.
| CSS strategy | Coverage |
|---|---|
| CSS custom properties | Limited coverage; use chart properties or SCSS overrides for deeper branding. |
| Sass/SCSS variable override | Theme variables can be overridden to customize appearance. |
| CSS Modules | Supported for scoped style integration. |
| Runtime multitenant theme switching | Basic CSS or class swaps are possible; full brand differences require deeper styling. |
| Dark mode | Use the built-in dark theme variants. |
| Theme Studio | Not available for Charts. |
| Brand / design system alignment | Use palettes, axis and label settings, and SCSS overrides to match the design system. |
CI/CD and testing compatibility
Ensure that React Charts fits within established build, test, and release workflows without introducing additional tooling requirements or infrastructure changes.
CI/CD pipeline compatibility
Charts-dependent features can be included in CI/CD pipelines using the same test infrastructure the rest of the application already uses.
Testing framework compatibility
The Charts works with all standard React testing tools without custom polyfills or separate test environments.
| Testing Tool | Compatibility | Notes |
|---|---|---|
| Jest | Fully supported | Blog reference |
| Vitest | Fully supported | Runs with jsdom or happy-dom. |
| React Testing Library | Fully supported | Use standard DOM queries; no vendor-only selector strategy is required. |
| Cypress | Fully supported | E2E tests run against Charts interactions without custom configuration. |
| Playwright | Fully supported | Chart elements can be addressed with standard locators. |
| Storybook | Supported | Supports visual-regression scenarios. |
Try live demo and navigate to the Testing tab to explore testing strategies, code examples, and validation scenarios.
2
Integration and extensibility
Validate React Charts integration with existing enterprise architecture, including data sources, state management, design systems, and security controls. Review support for data integration, authentication passthrough, API stability, extensibility, programmatic APIs, and multi-instance runtime behavior against application requirements.
Data and Back-end integration
Assess how React Charts integrates with application services, APIs, databases, ORMs, and authentication systems to support existing data access patterns and enterprise back-end architectures.
Data source integration
Select the appropriate data manager adaptor to translate Charts data operations into the back-end request and response formats. Prefer built-in adaptors for standard integrations to minimize manual handling.
| Adaptor | When to use | Enterprise benefit |
|---|---|---|
| URL adaptor | Use for standard REST endpoints. | Fits varied back ends, including microservice and cloud-native APIs. |
| ODataV4 adaptor | Use for services that implement OData v4. | Standardizes query construction and reduces custom API mapping. |
| Web API adaptor | Use for ASP.NET Web API services. | Aligns request and response handling with common .NET conventions. |
| GraphQL adaptor | Use for GraphQL endpoints such as Apollo, Node.js, or Hot Chocolate. | Requests the chart fields needed by the view; validate schema-specific mapping. |
| Web Method adaptor | Use for legacy ASP.NET ASMX services. | Modernizes the UI without forcing immediate back-end replacement. |
| Custom adaptor | Use for proprietary request or response contracts. | Provides full shaping control while retaining built-in adaptor behavior where useful. |
Try live demo and navigate to the Integration tab, then select Adaptors chip to access related resources and examples.
Back-end framework coverage
Select the adaptor by endpoint protocol rather than server language. Confirm the production response shape and authentication flow.
| Back-end pattern | Possible adaptors | Why this pattern fits |
|---|---|---|
| Django REST framework | URL adaptor, Custom binding | REST fits the URL adaptor; use custom binding for nonstandard envelopes or authentication. |
| Express and Node.js | URL adaptor, GraphQL adaptor, Custom binding | Choose URL or GraphQL integration according to the endpoint protocol. |
| FastAPI | URL adaptor, Custom binding | FastAPI exposes standard REST endpoints; custom binding covers nondefault response envelopes. |
| Flask and FlaskAPI | URL adaptor, Custom binding | Use the URL adaptor for normal REST; custom binding covers lightweight or proprietary conventions. |
| Next.js API routes | URL adaptor, Custom binding | API routes behave as REST endpoints, so the URL adaptor applies directly. |
| GraphQL in Node.js | GraphQL adaptor, Custom binding | Use the GraphQL adaptor; custom binding handles schema-specific differences. |
| GraphQL in Apollo | GraphQL adaptor, Custom binding | Use the GraphQL adaptor; custom binding handles schema-specific differences. |
| GraphQL in Hot Chocolate | GraphQL adaptor, Custom binding | Use the GraphQL adaptor for the .NET endpoint; custom binding handles schema-specific differences. |
| ASP.NET Web API | Web API adaptor, URL adaptor | Use the Web API adaptor for .NET conventions or the URL adaptor for generic REST. |
| Legacy ASMX | Web method adaptor, Custom binding | Use the Web Method adaptor; custom mapping covers legacy service variations. |
Database integration
Charts does not connect directly to databases. All database access must pass through application-owned APIs.
| Database | Possible adaptors |
|---|---|
| Microsoft SQL Server | URL adaptor, Web API adaptor, Custom adaptor |
| MySQL | URL adaptor, Custom adaptor |
| PostgreSQL | URL adaptor, Custom adaptor |
| SQLite Server | URL adaptor, Custom adaptor |
ORM compatibility
Charts has no direct ORM dependency. Any ORM can be used when the API returns the data required by the chart.
- Entity Framework Core (EF Core)
- Hibernate and Java Persistence API
- Django ORM
- SQLAlchemy
- Sequelize and Prisma
- Laravel Eloquent
- Dapper
- Custom ADO.NET, raw SQL, and stored procedures
Authentication passthrough
DataManager automatically applies configured authentication headers to requests, while authorization, token refresh, retries, and failure handling remain application-owned.
| Authentication pattern | Support and condition |
|---|---|
| JWT bearer token | Configured on the data manager and attached to every request. |
| OAuth 2.0 (PKCE and client credentials) | The application obtains the token; DataManager headers carry it to the endpoint. |
| Token refresh | Manage renewal through the request interceptor. |
| Mutual TLS (mTLS) | Configure certificates in the HTTP transport below DataManager. |
| Auth failure (401/403) | The failure event surfaces the response; the application layer owns retry, redirect, and messaging. |
API stability and extensibility
React Charts supports customization through documented extension points, React templates, typed events, and programmatic APIs, enabling flexible integration and maintainable implementations.
Versioning and API Stability
The Charts component follows semantic versioning. All public properties, events, methods, and template APIs are part of the stable public API surface.
| Change category | Policy |
|---|---|
| Breaking changes | Reserved for major releases. |
| New properties/events/methods | Added in minor releases without an intended breaking change. |
| Deprecations | Remain available during the deprecation window and are marked with TypeScript annotations. |
| Major version upgrades | Use the migration guide and before-and-after examples for the published changes. |
Extensibility Model
Use documented React templates and annotations for labels, legends, axes, tooltips, and empty states. Sanitize user-provided content before rendering.
| Extension point | Layer | What it replaces | Common use |
|---|---|---|---|
| Data label template | Data visualization layer | Default data label text | Render domain-specific value content. |
| Legend template | Legend layer | Default legend items | Replace default legend items with business terminology or custom UI. |
| No data template | Empty state layer | Default empty chart state | Show an application-specific empty state. |
| Axis label template | Axis layer | Default axis label text | Format axis labels for domain terms, units, or business conventions. |
| Tooltip template | Interaction layer | Default tooltip rendering | Present richer contextual information during interaction. |
| Annotation template | Annotation layer | Default annotation content | Place notes, alerts, markers, or React UI at chart locations. |
Try live demo and navigate to the Integration tab, then select Extensibility chip to access related resources and examples.
Programmatic API: Events and methods
Charts’ Event and Method APIs give the application complete control over Chart behavior at every stage—before, during, and after execution.
| Capability | Architectural implication |
|---|---|
| Pre-execution interception | Intercept supported lifecycle or interaction events and cancel where the API allows. |
| Render lifecycle control | Adjust load, series, point, and axis rendering before output is finalized. |
| Programmatic data binding | Refresh the visual when data changes without normally recreating the component. |
| Dynamic series control | Add or remove series at runtime. |
| Axis and scale control | Update ranges and scales as data or business rules change. |
| Tooltip and legend customization | Change tooltip and legend content at runtime. |
| User interaction capture | Use clicks and hovers to drive navigation, drill-down, or coordinated UI. |
| Zoom and pan control | Control zoom and pan, and synchronize the viewport across chart instances. |
| Multiformat export support | Trigger supported image or document exports; available formats depend on the Chart module. |
| Print layout control | Print through programmatic APIs with application-defined layout handling. |
| Animation control | Enable or disable animation according to the workload. |
| Theme and styling control | Update appearance for light, dark, or branded states. |
| Error and empty state handling | Detect missing or failed data and show fallback UI. |
| Accessibility and global readiness | Configure keyboard behavior, localization, RTL, and ARIA support. |
| Viewport-responsive layout | Adapt the layout for mobile and tablet viewports through configuration. |
| Instance isolation | Control every Chart through its own API instance. |
State management integration
React Charts supports integration with existing React state management solutions without imposing additional state layers or ownership models.
State management compatibility
Use Charts as a presentation component that receives data through props and exposes user interactions through events. Verify integration with the existing state management architecture without introducing additional data layers.
State management compatibility matrix
Pass application state to Charts as data and handle updates through chart events.
| State library | Connection pattern |
|---|---|
| Redux and Redux Toolkit | Pass store data as the source and dispatch from Chart event handlers. |
| Zustand | Pass a store slice and keep state updates outside the Chart. |
| TanStack Query and RTK Query | Pass query results and use events to trigger refetches or mutations. |
| React Context | Pass context data directly; no provider is required inside the Chart. |
| MobX | Pass observable data and rerender when it changes. |
| Jotai and Recoil | Pass atom values through the normal React data flow. |
Try live demo and navigate to the State Management tab to explore different integration patterns and verify data flow in real time.
Multi-Chart and Micro-Frontend integration
React Charts supports applications that use multiple chart instances or micro-frontend architectures, enabling modular composition while maintaining isolation across components and application boundaries.
Multi-Chart runtime behavior
Each Chart instance maintains independent state and rendering. The application controls any synchronization across charts.
| Runtime concern | Runtime behavior |
|---|---|
| State isolation between instances | Each Chart owns its configuration, data, events, and lifecycle. |
| Cross-Chart coordination | Use application state for synchronization; no implicit state sharing occurs. |
| Multichart dashboard composition | Several Charts can coexist with isolated state; profile the cumulative page cost. |
Micro-Frontend runtime behavior
Charts remains isolated inside each micro-frontend module. The shell owns shared package versions and version conflicts.
| Runtime concern | Runtime behavior |
|---|---|
| Micro front-end module boundaries | A Chart can mount or unmount inside one micro-frontend without changing sibling modules. |
| Lazy-load compatibility | Works with React.lazy, Suspense, and feature-level on-demand loading. |
| Independent upgrade path | Module-specific upgrades still require shell-level singleton and version governance. |
Review the micro-frontend architecture article for the referenced architecture pattern.
3
Performance and scalability
Validate Chart performance for large datasets, real-time updates, and complex visualizations. Review rendering, data-loading, zooming, and server-side data operation capabilities against expected scalability and responsiveness requirements.
Data processing performance
Review how React Charts supports data processing through remote and client-side data operations to meet application performance and scalability needs.
Server-side operations
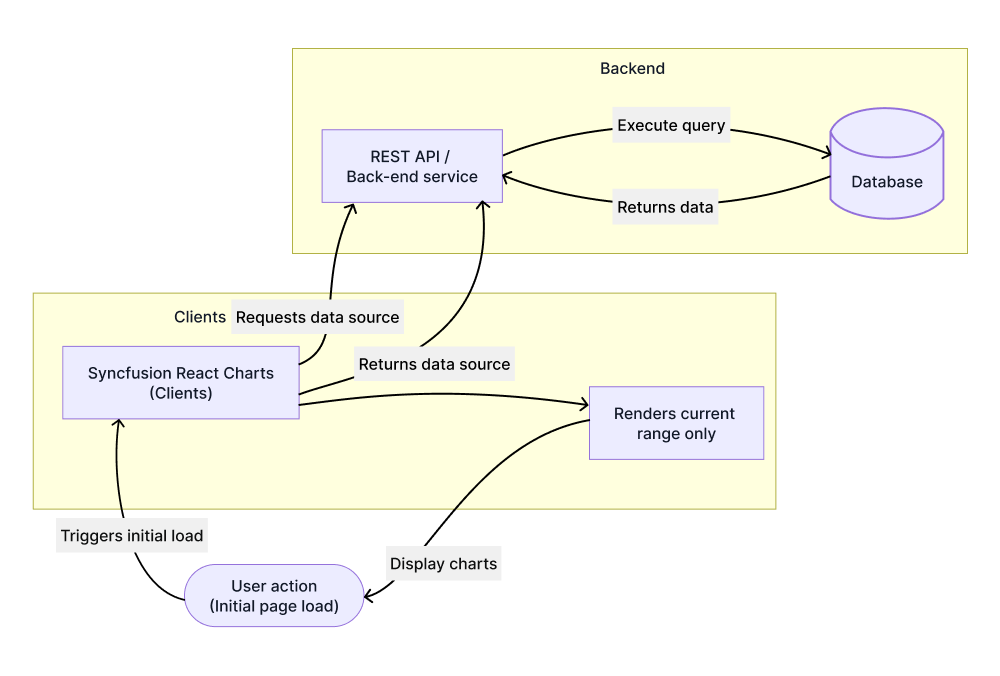
Use remote binding when the full dataset should not be loaded into browser memory. Use offline mode only when the complete dataset fits safely in memory.
| Server-side operation | Syncfusion React Charts coverage | Architectural benefit |
|---|---|---|
| Remote data (WebAPI) | Request the required range from a REST endpoint. | Limits payload size and avoids transferring the complete dataset. |
| OData binding | Build and send OData queries through DataManager. | Uses protocol conventions to reduce manual request code. |
| ODataV4 binding | Use the OData v4 query path. | Adds the query capabilities defined by the v4 protocol. |
| Custom adaptor | Extend an adaptor for proprietary request or response behavior. | Keeps DataManager orchestration while supporting a nonstandard service. |
| Offline mode | Load the complete authorized dataset once and process it locally. | Avoids repeated requests for moderate, stable datasets. |
Performance benchmarking and validation
Consider benchmark results in relation to the tested environment, workload, dataset, and measurement methodology when assessing performance and scalability.
Benchmark scenario
Use benchmark results to validate performance and scalability targets. Verify initial load, zooming, date-time axis, and scatter rendering behavior with representative dataset volumes.
| Scenario | Measurement | Architectural relevance |
|---|---|---|
| Initial load | Time to first chart render and completion of the first SVG paint | Establishes baseline page-load impact. |
| Selection zooming | Time to apply and render a selected zoom range | Shows responsiveness during focused data exploration. |
| Mouse wheel zooming | Latency to zoom in or out using the mouse wheel | Measures responsiveness for continuous zoom interactions. |
| Date-time axis | Time to render a date-time axis across varying data volumes | Captures time-series axis calculation and labeling cost. |
| Scatter | Time to render large numbers of scatter data points | Measures high-density point rendering throughput. |
Testing environment
- Component: Syncfusion React Charts 2026 Volume 1, version 33.1.44.
- Framework: React (production build).
- Browser: Google Chrome 122.x.
- Operating system: Windows 11 64-bit.
- Hardware: AMD Ryzen 5 7520U processor, 16 GB RAM, AMD Radeon graphics.
- Dataset: 100,000 datapoints.
- Method: Action lifecycle events, capturing the duration from operation start to completion of the corresponding UI update.
Results can change with hardware, browser, viewport, data volume, columns, enabled features, templates, and application configuration.
Benchmark results
The interactive benchmark sample can be used to evaluate approximate performance for initial load and zooming with large datasets. Results should be interpreted in the context of the documented testing environment, as performance may vary depending on hardware, browser, and configuration.
| Operation | 100,000 points (ms) |
|---|---|
| Line type (Category) - Initial load | ~618 |
| Line type (Category) - Zooming | ~141 |
| Line type (Datetime) - Initial load | ~778 |
| Line type (Datetime) - Zooming | ~149 |
| Scatter - Initial load | ~2486 |
Try live demo and navigate to the Performance tab to view and validate live performance metrics.
Real-time performance and scalability
Assess how React Charts handles continuous data updates and increasing workload demands across datasets, series, and chart instances to support scalable application scenarios.
Real-time update performance
Append data and refresh the affected series without recreating the component. Disable animation for high-frequency feeds.
| Update scenario | Coverage and condition | Rendering behavior |
|---|---|---|
| Live data appending (single point) | Supported via dataSource push + refresh() | Updates the changed series path instead of recreating the component. |
| High-frequency data feeds | Supported with animation disabled. | Reduces repeated animation work during sustained feeds. |
| Live data with zooming active | Supported. | Keeps the active zoom range while new data arrives. |
| Real-time updates with scrollbar | Supported. | Maintains the current scrollbar position during updates. |
| Streaming updates with large datasets | Supported. | Applies data incrementally rather than rebuilding the full dataset. |
| Continuous updates during legend interaction | Supported. | Preserves the current series-visibility state. |
Scalability beyond data count
Validate scalability across dataset size, series count, concurrent Charts, and dashboard complexity while maintaining efficient rendering and predictable memory usage.
| Scale dimension | Syncfusion React Charts coverage | Architectural behavior |
|---|---|---|
| Number of data points | Use zooming and lazy or range loading for large point sets. | Render the visible range to constrain SVG work. |
| Series count | Supports multiple series in one Chart. | Calculates visible series independently. |
| Concurrent chart instances | Supports multiple Chart instances on one page. | Every instance owns its rendering layer and lifecycle. |
| Dynamic data at runtime | Update the data source and series configuration at runtime. | Reconfigures the Chart without a full component reinitialization. |
| Multichart dashboards | Supports dashboard layouts containing several Charts. | Each Chart manages its own pipeline, while total page cost remains cumulative. |
| Grouping with large datasets | Use the range selector and scrollbar for long histories. | Show the selected range at full detail while broader history remains navigable. |
4
Security and compliance
Confirm that all Chart rendering and processing execute locally in the browser using standard web APIs. Enforce security, compliance, and data governance requirements, including access control, data filtering, export policies, and tenant boundaries, within application and back-end layers.
Security architecture and responsibilities
Distinguish between capabilities provided by React Charts and the security, governance, and operational controls that remain the responsibility of the application, back-end services, and infrastructure.
Security responsibility matrix
Charts is a browser visualization layer. Authentication, authorization, validation, masking, audit logging, and export policy remain application responsibilities.
| Security area | Component behavior | Application responsibility |
|---|---|---|
| Authentication | No built-in authentication; the component displays only supplied data. | Authenticate users and protect every chart-data endpoint. |
| Authorization | No role or permission engine; every supplied series can render. | Filter metrics and series according to RBAC before returning data. |
| Data validation | Does not verify types, ranges, series integrity, or metric meaning. | Validate chart data and business semantics in trusted services. |
| Input sanitization or XSS | Text and templates rely on safe application-provided content. | Sanitize or encode untrusted labels, tooltips, and annotations. |
| Data transformation and aggregation | Handles visual transformation only and does not validate business metrics. | Aggregate, calculate, and validate analytics in the back end. |
| CRUD operations | Visualization is read-only and does not modify server records. | Secure drill-down or related data APIs and validate every parameter. |
| Interaction events | Emits callbacks without authorizing the resulting action. | Authorize downstream requests and log sensitive interactions. |
| Transport security | Provides no transport or header enforcement. | Use HTTPS or TLS, secure CORS and HSTS, and protect tokens. |
| Data masking or sensitivity handling | Data masking or sensitivity handling. | Mask or anonymize metrics and enforce tenant separation before binding. |
| Audit logging | Provides no built-in interaction log. | Capture relevant chart and data-access events in the audit system. |
| RBAC & multitenancy | Has no tenant or role awareness. | Scope every dataset to the authenticated user and tenant. |
| Export & print controls | Can export visuals but does not apply permission or masking rules. | Authorize export, mask sensitive content, and restrict downloads. |
| Client-side rendering security | Runs in the browser through DOM, SVG, or Canvas without server file writes. | Secure templates and annotations and apply the required browser headers. |
| Performance & rate limiting | Does not limit payload size or request rate. | Apply API rate limits and dataset-size controls. |
| Third-party integration security | Loads no external integration unless the application adds it. | Vet scripts and data sources and prevent unsafe injection. |
| Data lifecycle & storage | Keeps supplied data in browser memory for rendering without component persistence. | Limit sensitive-data lifetime and clear application-managed caches where required. |
Security architecture overview
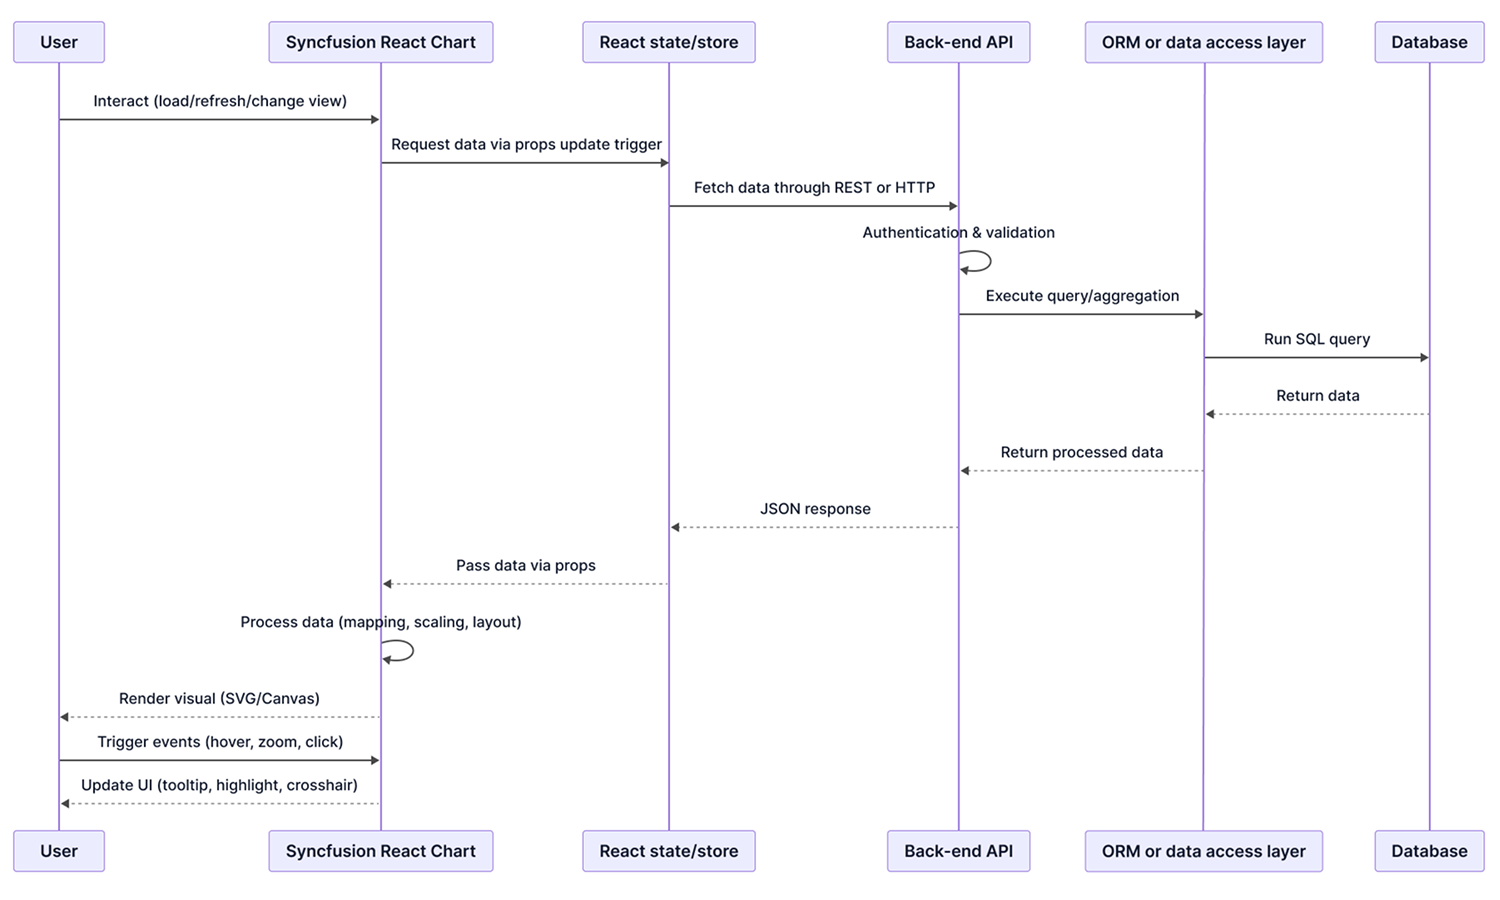
Authorize and prepare data before passing it to Charts. Handle authentication, authorization, and processing in application services, and validate interaction-driven actions before execution.
OWASP security responsibility context
Review OWASP-relevant risks for Charts and validate that security controls are enforced by the host application where the component does not provide them directly.
| OWASP risk area | How it relates to the Scheduler | Responsibility |
|---|---|---|
| A01: Broken Access Control | Renders supplied datasets without row, metric, role, or tenant checks. | Enforce access rules server-side and return only authorized analytics. |
| A03: Software Supply Chain Failures | A third-party npm dependency whose trust depends on package provenance and pipeline controls. | Pin versions, scan dependencies, and apply updates promptly. |
| A04: Cryptographic Failures | Uses the application's transport and provides no internal encryption. | Require HTTPS or TLS and protect analytic payloads. |
| A05: Injection | Untrusted labels, tooltips, legends, or annotations can become injection surfaces. | Sanitize or encode every user-controlled value before binding. |
| A07: Authentication Failures | Does not manage identity, sessions, or tokens. | Implement authentication in the application and identity provider. |
| A08: Software or Data Integrity Failures | Package integrity depends on trusted sources, lockfiles, and controlled distribution. | Use internal registries, restricted CI/CD, and integrity verification. |
| A09: Security Logging and Alerting Failures | Provides interaction events but no security log. | Log data requests, drill-downs, and suspicious access patterns. |
Application and data security
Evaluate data flow, access controls, deployment behavior, and export policies as part of the application’s overall security and compliance strategy.
Data flow and network behavior
Provide data through the application and validate all network access externally. Charts performs client-side rendering only and does not initiate API calls, WebSockets, or background requests.
- Define API routes and endpoint exposure in the application and back-end architecture.
- Attach authentication and authorization context through the application networking layer.
- Revalidate permissions, input, and data scope in back-end services before returning chart data or drill-down results.
- Apply WAF, proxy, gateway, traffic inspection, and monitoring controls at the normal infrastructure boundary.
Authentication and authorization integration
Implement authentication, authorization, session control, tenant isolation, and visibility rules in the application and back end. Use Chart interaction hooks to apply application-specific access controls.
| Security requirement | Chart capability | Security enforcement layer |
|---|---|---|
| Dataset visibility or metric access | Displays the supplied dataset without role-aware filtering. | Return only permitted metrics and bind only approved series. |
| Series level access control | Renders every series included in configuration. | Remove restricted series before the Chart is created. |
| Drill down & interaction permissions | Provides events but makes no permission decision. | Authorize parameters and every downstream drill-down request. |
| Data filtering based on role or tenant | Does not fetch or filter data by role on its own. | Apply tenant and role filters server-side and bind the authorized subset. |
| Sensitive data masking | Displays values exactly as supplied. | Mask or obfuscate sensitive values before binding. |
| Read only visualization mode | Does not write server records. | Keep metric and drill-down APIs read-only unless a separate write path is authorized. |
| Export access control | Offers export APIs but does not enforce export authorization. | Gate export by role, mask data, and log the action. |
| Data label & annotation content | Displays supplied labels, legends, tooltips, and annotations. | Provide authorized content and sanitize user-controlled values. |
| Validation of user interactions | Emits callbacks without access validation. | Authorize any data request triggered by zoom, selection, or drill-down. |
| Audit logging of analytics access | Exposes interaction events for application logging. | Send dataset, KPI, and drill-down access events to audit or SIEM systems. |
| Multitenant & role-based metric control | Has no tenant model or role segregation. | Enforce tenant scoping in the back end and bind only tenant-safe data. |
Deployment security characteristics
Verify deployment without external runtime dependencies, dynamic code execution, or outbound network communication, including in restricted and isolated environments.
| Deployment characteristic | What it means |
|---|---|
| No external runtime connections | No vendor or third-party runtime call is required; only application-supplied data is rendered. |
| Fully self-hosted | Scripts, styles, SVG or Canvas logic, and utilities ship in the package; an external CDN is not required. |
| Air-gapped or restricted network compatible | Can run offline when the application supplies local assets and data. |
| Internal-registry-compatible | Static package assets can be mirrored through enterprise registries. |
| CSP compliant | The Chart uses standard React rendering and static assets with no eval, no dynamic HTML injection, and no prohibited runtime constructs. |
| No background service dependency | Requires no cloud analytics, telemetry, or external rendering engine. |
| Self-contained visualization engine | Axis, animation, layout, and rendering logic are included in the package. |
| Offline/isolated environment ready | Supports isolated deployment with locally supplied data. |
| Private registry support | Can be installed entirely from internal repositories. |
| Strict CSP alignment | Designed for policies that block inline scripts and unsafe-eval; validate the complete application. |
| No dynamic code evaluation | Does not use no eval(), Function constructor, or generated script execution. |
| Zero outbound diagnostics | Sends no component telemetry, usage metrics, or call-home diagnostics. |
| Client-side rendering & calculations | Runs scaling, data binding, animation, color mapping, and tooltip logic in the browser. |
| No external visualization-service dependency | Uses no external visualization service at runtime. |
| Independent view generation | Renders chart types locally through SVG or Canvas. |
| Local interaction handling | Processes interactions locally unless application code starts a network request. |
| Local accessibility & ARIA logic | Generates accessibility roles and ARIA behavior locally. |
| Print-ready client rendering | Chart export or printing relies entirely on browser capabilities; no server-side rendering or export engines are required. |
Export security
Exports contain the data and annotations supplied by the application. Apply authorization, masking, tenant isolation, and audit rules before export.
| Export security concern | How it is addressed | Enforcement location |
|---|---|---|
| Who can trigger an export | Show, hide, or disable export UI by role; the component has no RBAC. | Application layer |
| What data appears in the export | Export reflects the Chart content supplied by the application. | Application layer |
| Export to Syncfusion servers | Generate locally or through the application back end; no Syncfusion transfer is required. | Component architecture |
| Export audit logging | Intercept the export command and record it for audit or monitoring. | Application to logging or audit system |
| Server-side export path | Route through an application-owned export service and protect the endpoint. | Application to back-end export service |
| Data sensitivity control | Mask or sanitize sensitive KPIs before chart binding and export. | Back-end or application layer |
| Visible range export limits | Limit export to an authorized range when required; the component does not enforce scope. | Application layer |
| Drill down export rules | Authorize drill-down data before it enters an export. | Application layer to back-end authorization |
| Multi tenant export isolation | Prevent cross-tenant data in the back end because the component has no tenant awareness. | Back end layer |
| Tooltip or annotation exposure | Set authorized time or range limits and review tooltip or annotation content before export. | Application layer |
| Rendering engine behavior | Uses local SVG or Canvas output and does not require an external renderer. | Component architecture |
| Export consistency across filters | Exports the active filter state; verify that every applied filter is authorized. | Back end to application layer |
Compliance and security assurance
Review certification, vulnerability-management, and runtime-assurance evidence to support procurement and deployment decisions.
Compliance certifications
Review Syncfusion security, privacy, and accessibility certifications, and validate compliance requirements against organizational procurement and assessment standards.
| Certification or standard | Syncfusion coverage | Procurement reference |
|---|---|---|
| SOC 2® Type 2 | Syncfusion describes independently audited controls for development and operations. | SOC 2® Type 2 overview |
| GDPR | Syncfusion publishes GDPR-aligned processing information for privacy review. | GDPR overview |
| WCAG 2.1 AA (accessibility) | Published accessibility material describes WCAG 2.1 AA testing for the component suite. | Accessibility standards |
| ISO 27001 | Request the current certification status through enterprise engagement. | Contact sales team for certification information |
| Section 508 | Published accessibility guidance supports a Section 508 review. | Section 508 documentation |
Vulnerability management
Review security updates regularly, validate deployed versions against disclosed fixes, and use the responsible-disclosure process to report vulnerabilities.
| Vulnerability-management area | Syncfusion coverage |
|---|---|
| Responsible disclosure policy | A public reporting channel covers potential issues in Charts and other libraries. |
| Security patch delivery | Security fixes are delivered through product and npm package updates. |
| Security fix documentation | Release notes and history identify security-relevant fixes and dependency changes. |
| Enterprise security escalation | Enterprise customers use the priority support path defined by the applicable SLA. |
| Dependency vulnerability monitoring | Dependencies are monitored and updated through regular maintenance releases. |
Review regulatory compliance guidance for additional compliance information.
Security assurance statements
Review and independently validate Chart security characteristics and Syncfusion’s supporting vendor security practices during security assessments, penetration testing, and procurement evaluations.
| Assurance statement | Verification method |
|---|---|
| The Chart component does not initiate outbound calls to Syncfusion or third party services. | Check DevTools Network tab to confirm no external domains are loaded. |
| No runtime inline-style injection | Inspect Elements panel and CSP logs to ensure no inline styles are injected. |
| No dynamic code evaluation | The rendering path does not use eval, Function constructors, or generated scripts. |
| Data-point content cannot execute scripts | Data-point content should not execute as script. |
| No component ownership of tokens or sessions | The component does not own authentication tokens or session identifiers. |
| Vendor security and accessibility evidence is available | Vendor security and accessibility documents are available through enterprise channels. |
| Published accessibility conformance information | Accessibility conformance information is published for review. |
| Security and dependency fixes follow regular releases | Security and dependency fixes are delivered through the normal release cycle. |
| No component persistence of analytics data | Chart data is not persisted by the component to browser storage. |
| Interactions do not automatically create external requests | Chart interactions do not automatically contact external services. |
| Application-controlled drill-down networking | Drill-down callbacks fetch data only when application code initiates the request. |
| Local color, axis, and scale calculations | Color, axis, and scale calculations run in the browser. |
| Browser-local SVG and Canvas rendering | SVG and Canvas rendering run locally in the browser. |
| No external data transfer during local export | Chart export does not send data to an external service by default. |
| No dynamically downloaded charting library | No graphics library is downloaded dynamically at runtime. |
| No cloud processor for animation or layout | Animation and layout calculations do not depend on a cloud processor. |
| No component telemetry or diagnostic transmission | The component sends no telemetry or diagnostic payloads. |
5
Interactive live demos
Use the interactive live demos to assess the component in representative usage scenarios. Explore key capabilities, interactions, configuration options, and runtime behavior to validate functional fit and user experience against application requirements.
Try our Live Demo
6
Evaluation checklist
Print or copy this checklist into the evaluation record. Each item maps to a technical claim, limitation, responsibility boundary, or verification method documented in the sections above.
01. Runtime compatibility
- The target React version maps to a supported Syncfusion version.
- Next.js App Router usage is isolated behind the required client-component boundary.
- Streaming SSR, ISR, and Edge behavior are verified in the actual deployment model.
- All required browsers are tested with rendering, interactions, accessibility, and export.
02. Build and application architecture
- The package builds successfully with the production bundler, TypeScript settings, and CSS pipeline.
- ESM, CommonJS, or UMD usage matches the application and test environment.
- Micro-frontends use a shared singleton or another tested version-alignment strategy.
- The state-management approach uses existing application patterns without a parallel store.
- Branding is achievable through built-in themes, chart properties, palettes, and SCSS without relying on Theme Studio.
- The existing unit, integration, end-to-end, accessibility, and visual-regression pipelines cover chart behavior.
03. Data, API, and Extensibility
- The selected adaptor matches the production API contract, or custom transformation work is estimated.
- Remote data queries return only authorized ranges and series for the current user and tenant.
- JWT, OAuth, token refresh, mTLS, and 401 or 403 handling remain application controlled.
- Required render events, drill-down interactions, dynamic series operations, zoom synchronization, and export methods are verified.
- Templates and annotations are sanitized when they include user-controlled content.
- Multiple charts and micro-applications coordinate only through the application state layer.
04. Performance and scalability
- Representative point counts, series counts, labels, markers, tooltips, and chart types are profiled together.
- Remote range loading or offline mode is selected using browser-memory and latency constraints.
- Animation is disabled or tuned for high-frequency update scenarios.
- Zoom and scrollbar state remain stable during live updates.
- Concurrent chart instances are profiled as a complete dashboard on target hardware.
- The proof of concept records repeatable measurements and acceptance thresholds.
05. Security and compliance
- The back end enforces dataset, series, metric, tenant, and drill-down authorization.
- User-provided labels, categories, tooltips, legends, and annotations are validated or sanitized.
- Runtime network behavior confirms no calls to Syncfusion or unexpected third parties.
- CSP, storage, telemetry, offline deployment, and internal-registry requirements are verified.
- Export permissions, masking, filter scope, tenant isolation, and audit logging are implemented.
- Current accessibility, compliance, release, disclosure, and support evidence is available for procurement.
06. Final decision
- Every conditional requirement has an owner, mitigation, evidence link, and target date.
- Unsupported requirements and source limitations are documented explicitly.
- The recommendation is recorded as pass, conditional pass, or fail.
- The final decision reflects production-shaped evidence rather than feature-demo behavior alone.
7
Frequently asked questions
Review the questions that most often affect architecture fit, analytical scale, security approval, and long-term adoption.
Can React Charts render 100,000 or more data points?
Yes. React Charts can render 100,000 or more data points, particularly when rendering and path calculations are restricted to the visible axis range. Actual performance varies based on chart type, series count, visual features, and device capabilities. Review the related reference.
Does React Charts support real-time data feeds without recreating the component?
Yes. React Charts support appending data and refreshing the series without reinitializing the entire chart. For frequent real-time updates, disable animation to reduce repeated rendering overhead. Review the related reference.
Is zoom state preserved during live updates in React Charts?
Yes. In React Charts, the current axis range, scrollbar position, and zoom level are preserved across refresh operations unless application code explicitly changes the range. Review the related reference.
How should datasets that exceed browser memory be handled in React Charts?
In React Charts, use application-configured remote binding through Web API, OData, OData v4, GraphQL, or a custom adaptor. The back end should return only the authorized data range required for the current view. Review the related reference.
Can React Charts use GraphQL without a fully custom data layer?
Yes. React Charts provide a GraphQL adaptor, although request and response mapping may still be required for the application schema. Review the related reference.
Do React Charts work with both Next.js Pages Router and App Router?
Yes. React Charts can be used in both routing models. In the App Router, the interactive chart must be placed inside the recommended client-component boundary. Review the related reference.
Can multiple React Charts be synchronized?
Yes. Application logic can coordinate zoom, pan, selection, drill-down, or visible ranges across independent React Chart instances using the event and method APIs. Review the related reference.
Do React Charts enforce data access permissions?
No. React Charts renders the datasets and series supplied by the application. The back end must enforce user, role, metric, tenant, and drill-down permissions before data reaches the browser.
Is strict Content Security Policy (CSP) deployment supported in React Charts?
Yes. React Charts do not require inline scripts, inline CSS, or unsafe-eval for standard use. Validate the complete application, templates, annotations, and export workflow under the organization’s actual CSP.
Is Theme Studio supported for React Charts?
No. Theme Studio is not supported for React Charts. Use built-in themes, palettes, chart properties, and SCSS or theme overrides for deeper branding.
Is accessibility documentation available for React Charts?
Yes. Accessibility documentation for React Charts is available, including WCAG 2.1 AA and Section 508 compliance information. Verify the specific chart types, keyboard interactions, labels, color usage, and screen-reader behavior required by the application. Review the related reference.
How are security fixes and vulnerabilities handled for React Charts?
Syncfusion documents a responsible-disclosure process and delivers fixes for React Charts through regular releases. Review the deployed version against current release notes and the release history, and use the enterprise escalation path when required. Review the related reference.
8
Resources
Use these references after reviewing the guide and FAQs to continue implementation, validation, troubleshooting, and design evaluation.
- React Charts documentation- Start with installation and basic configuration.
- Knowledge base articles- Review task-specific solutions and troubleshooting guidance.
- Tutorial videos- Follow feature walkthroughs in video format.
- Feature walkthrough video- See a guided product overview.
- Live interactive demo- Explore the Charts in a browser.
- Feature web story- Review a brief visual feature summary.
- Figma UI kits- Check available design assets.







